What Happened at the Month-End Fix?
Posted by Colin Lambert. Last updated: January 11, 2024
2023 closed out on a nasty note for users of the WM five-minute benchmark fix with the last two months of the year producing the highest potential savings from following the Siren benchmark, which is calculated over a 20-minute time horizon.
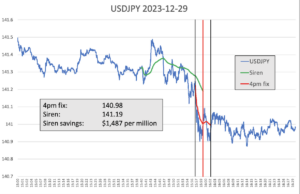
After providing savings of more than $1,000 in November, in December the savings across a portfolio of nine currency pairs tracked, stayed high at $869 per million. Of particular note was a blow-out in execution costs in USD/JPY between the two methodologies for the second month in a row, although the $1,487 per million savings were almost matched both those in another major pair, USD/CHF at $1,464 per million.
The savings in both pairs was more than double the 33-month average since The Full FX started tracking this data. Reinforcing the market impact in December was EUR/USD which, while lower than the yen and Swiss franc, still provided potential savings of $733 per million, comfortably above its $601 longer-term average.
Other pairs were quieter than average, namely Cable, USD/CAD and NZD/USD, while there were differing fortunes for the two Scandi pairs, with USD/SEK more than double its 33-month average (and the highest potential saving for the month) and USD/NOK just two-thirds of its.
To provide more context, the table below also presents projected dollars per million savings across a portfolio of different pairs using a correlation with the Fix calculation, depending upon how much flow was in the direction of the market, or “with the wind”. The Full FX has verified that the WM rates used here are a reasonable reflection of that fixing.
| December 29 |
| CCY Pair | WMR 4pm Fix* | Siren Fix | 100%** | 80% | 70% | 60% |
| EUR/USD | 1.10473 | 1.10554 | $733 | $440 | $293 | $147 |
| USD/JPY | 140.98 | 141.19 | $1,487 | $892 | $595 | $297 |
| GBP/USD | 1.27467 | 1.27409 | $455 | $273 | $182 | $91 |
| AUD/USD | 0.68229 | 0.68183 | $675 | $405 | $270 | $135 |
| USD/CAD | 1.31856 | 1.31884 | $212 | $127 | $85 | $42 |
| NZD/USD | 0.63314 | 0.63286 | $442 | $265 | $177 | $88 |
| USD/CHF | 0.84165 | 0.84042 | $1,464 | $878 | $586 | $293 |
| USD/NOK | 10.15145 | 10.14793 | $613 | $368 | $245 | $123 |
| USD/SEK | 10.07785 | 10.06034 | $1,740 | $1,044 | $696 | $348 |
| Average | $869 | $521 | $348 | $174 |
*According to Siren FX calculation using NewChange FX data
** Savings are in dollars per million by percentage of correlation to the Fix flow. Blue cells signify a projected saving using Siren, Red cells a saving using WMR
The two markets to see the largest impact, USD/SEK and USD/JPY, had very different experiences for the December month-end, with one seemingly driven by large flows and the other exhibiting a classic example of (pre)hedging.
Amidst some whippy price action at what would have been a very thin time of the year in liquidity terms, USD/JPY only dropped some 15 pips in the period between the Siren fix opening at that of WM. This does, however, mask two or three small buying spurts in that period that helped provide a significantly better rate from the Siren fix.

Source: Siren FX
More notable, in the big picture, is that USD/JPY seemed subject to persistent selling of dollars, something that was reflected in the overall price action. There was a sharp 30-plus point drop at the start of the WM window, with price action proceeding to whip around for the remainder of the five minutes. Unlike some instances of high market impact in this ongoing study, however, USD/JPY remained close to its lows for the period immediately after the ending of the WM calculation window.
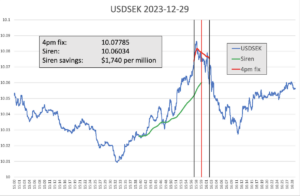
It was the exact opposite in USD/SEK, the pair with the highest potential savings during this month-end fix at $1,740. Here the market was driven steadily higher by buyers ahead of the WM window – indeed there was an almost 500-point move in the pair between the start of the two calculation periods, with the Siren calculation capturing almost all of the (pre)hedging flow.

Source: Siren FX
Reinforcing the evidence that there was heavy buying ahead of the WM window is the fact that USD/SEK actually went down during that window – after jumping around 100 points at the start, the pair drop some 250 points to exit the WM window at the low for that five minutes.
Again, in a classic example of (pre)hedging, the period immediately after the WM window saw USD/SEK continue to decline – some nine minutes after the close of the WM calculation window, it was close to where the Siren calculation window started. This means there was an almost 1200 point cumulative move in USD/SEK in a 30-minute window either side of the WM Fix.
Every month, The Full FX is selecting an emerging market currency pair at random, and before the data is available, to broaden the analysis – this month the selected pair is USD/HUF. Data is again provided by Siren FX according to the same guidelines in place for the regularly reported currency pairs.
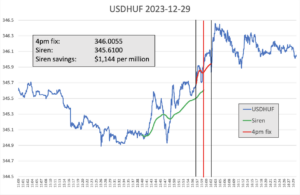
The savings for December were very much in line with the 32-month average since The Full FX started tracking emerging markets pairs at $1,144 per million. Again, the price action appears to have reflected demand for dollars at the month-end, although there were some nasty moves along the way.

Source: Siren FX
Price action in the WM window was a little whippy, but the exit from the window saw the buying continue for one or two minutes, before there was a steady decline. The broader picture indicates that a lot of activity was focused on the 30 minutes around the fixing window, with the market being relatively steady either side of what would have been a thin day for liquidity.

