What Happened at the Month-End Fix?
Posted by Colin Lambert. Last updated: September 8, 2023
Market impact was once again a factor at the August month-end FX fix with the potential savings from a window using a longer calculation hitting their highest level in 2023.
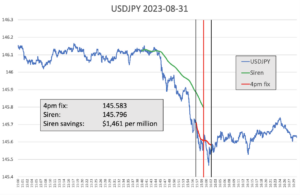
Overall, across the portfolio of nine currency pairs tracked, the saving using the Siren FX 20-minute benchmark calculation, was $766 per million, compared to the five-minute WM window. This is the highest since November 2022. Worryingly, given the size of the market, the highest savings were in USD/JPY at $1,461 per million – easily the highest market impact cost in the 29 months The Full FX has been tracking this data. It was a tough month also for anyone seeking to execute in NZD at $1,430 per million, as well as USD/NOK at $1,109 per million.
While the average cost was higher than the 29-month average, only the three aforementioned pairs provided savings above their averages over the same time horizon. It was, however, the second costliest month of the year for EUR/USD and Cable.
| August 31 |
| CCY Pair | WMR 4pm Fix* | Siren Fix | 100%** | 80% | 70% | 60% |
| EUR/USD | 1.08534 | 1.08477 | $525 | $315 | $210 | $105 |
| USD/JPY | 145.583 | 145.796 | $1,461 | $877 | $584 | $292 |
| GBP/USD | 1.26715 | 1.26646 | $545 | $327 | $218 | $109 |
| AUD/USD | 0.64759 | 0.64714 | $695 | $417 | $278 | $139 |
| USD/CAD | 1.3529 | 1.35345 | $406 | $244 | $163 | $81 |
| NZD/USD | 0.59536 | 0.59451 | $1,430 | $858 | $572 | $286 |
| USD/CHF | 0.88327 | 0.88348 | $238 | $143 | $95 | $48 |
| USD/NOK | 10.63922 | 10.65103 | $1,109 | $665 | $444 | $222 |
| USD/SEK | 10.94809 | 10.94280 | $483 | $290 | $193 | $97 |
| Average | $766 | $460 | $306 | $153 |
*According to Siren FX calculation using NewChange FX data
** Savings are in dollars per million by percentage of correlation to the Fix flow. Blue cells signify a projected saving using Siren, Red cells a saving using WMR
The USD/JPY move looks to have been driven by the sheer size of flow attempting to be executed. There was a clear move lower ahead of the five-minute WM window, the market dropping some 45 points in the 15 minutes prior as executing parties (pre)hedged the orders, however selling also continued into the WM window itself.

Source: Siren FX
All orders appear to have been satisfied in the 20 minutes to the end of that window as the market stabilised immediately after, having, as often happens, drifted higher into its close.
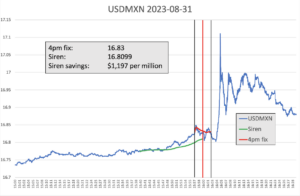
Every month The Full FX is selecting an emerging market currency pair at random, and before the data is available, to broaden the analysis – this month the selected pair is USD/MXN. Data is again provided by Siren FX according to the same guidelines in place for the regularly reported currency pairs.
The USD/MXN chart is an interesting one as one of two things likely happened. Firstly, there could have been a significant USD/MXN buy order in the market that was partly filled by the general dollar selling flows at the Fix that were witnessed across the market. Once the Fix was completed and the selling flow was complete there was a sharp spike.

Source: Siren FX
While that is the most likely factor behind the move, a second potential reason could be that players keyed on hedging ahead of the window to go short and were then caught out and had to scramble to cover shorts.
Overall, at $1,197 per million saving, this month is fractionally above the 28-month average for EM pairs and is only the fourth largest potential saving this year.

