Mixed News for FX Sales Desks in BIS Report
Posted by Colin Lambert. Last updated: October 28, 2022
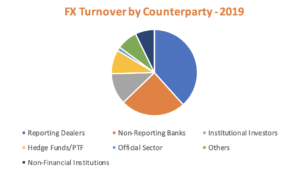
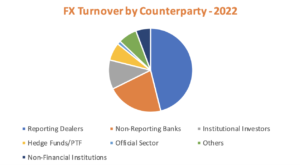
The 2022 BIS Triennial Survey of FX Turnover offers mixed news for sales desks, with fortunes very much dependent upon what segment the desk services, for while the headline data is largely unchanged from 2019, different client sectors have gone in opposite directions since that report.
After the surge in activity from 2016 to 2019, non-reporting banks – by far the largest “buy side” segment in the report, flattened out in 2022 at $1.619 trillion, just 0.4% higher than 2019. Perhaps reflecting how many of these institutions dedicate their balance sheet to core client bases, while spot, outright and FX option volumes with this sector rose, the gains were almost wiped out by a decline in FX swap activity.
In 2019, non-reporting banks traded $966 billion per day in swaps, in the latest survey this was down to just over $909 billion – the suggestion being these firms internalised more client business on their risk books rather than pass it on to larger players. One thing that was unlikely, given the decline in local trading in FX swaps, is that these players shifted the risk with other non-reporting players. In the 2019 report, 46.2% of FX swaps business was executed with local counterparties, in the latest report this has dropped to 35.5%.
In spot, non-reporting banks executed just over $456 billion per day in 2022, up just under 2% from 2019, while in FX options, this sector traded $54.1 billion, up from $50 billion in 2019. Outright forward activity offered the largest growth, rising to $162.1 billion from $126 billion.
Investors Off Spot, on Swaps
In the latest survey, institutional investors have increased their level of activity, while hedge funds and prop trading firms (PTF) have declined in influence. That said, the growth comes almost exclusively in FX swaps, with both sectors showing a decline in spot activity – something that may come as a surprise given the increased volatility seen in exchange rates (and interest rates) throughout this year.
Banks in particular, from a trading and sales perspective, have focused more on “real money” than hedge funds and while this has paid off in swaps, the opposite is true in spot. The institutional investor segment executed $227.7 billion in April 2022, a significant 26.1% drop from the 2019 survey, which was compensated by a 40.5% increase in FX swap activity from this segment to $297.8 billion per day. This is the first time that FX swaps have overtaken spot as far as the institutional investor segment is concerned since the BIS started collating the data.
With spot and swaps largely offsetting each other, and FX options unchanged at $33 billion per day, the top-line growth from investors came thanks to outright forwards, which grew from $$215 billon in 2019, to $281.7 in April 2022.
It was a similar story, albeit more muted, in the hedge fund/PTF segment, which saw overall activity decline by 13.4% to $513.7 billion. Within this, spot volumes dropped from $261 billion to just under $223 billion in 2022, while FX swaps activity rose from $123 billion to $129.7 billion. There were also declines of 23.7% in outright forwards (to $117.5 billion) and of 10% in FX options ($40 billion) to round out a worrying report for anyone in this sales environment.


One factor to consider when looking at the hedge fund data, however, could be the changing dynamic in the non-bank market maker segment. Anecdotally in recent years, this sector has seen some players pushed out by high levels of competition, and although other firms have moved in, their approach is less focused on the high turnover, incremental profit, model, than short-term directional.
To a degree, this decline is reflected in the prime brokerage data in the latest report, which indicates that spot volume via a prime broker in 2022 was $793.1 billion per day, down 13.6% from 2019.
Non-Financial Decline Continues
A feature of the BIS surveys for some time now has been the seemingly endless decline of the non-financial sector in FX markets – typically corporates. This segment peaked in the 2007 survey in terms of notional turnover, and while the decline has been steady from that peak of $593 billon per day, at $424.8 billion in 2022, activity is below that in 2019 (by 10.3%) but higher than in 2016.
Perhaps the reduced importance of this sector to the market is revealed in the percentage of volumes from non-financials. In the aforementioned 2007 report this sector was responsible for 17.8% of flow, in the latest survey that is down at 5.7%.
The increased influence of sovereign wealth funds and other government bodies is reflected in higher activity from the official sector. In 2022 across all products, this sector traded $98.8 billion per day, the highest yet and up 11% from 2019.
The non-financial data is interesting when looked at through the prism of increased exchange rate volatility. As has been highlighted by repeated Kyriba Currency Impact Reports, corporations are increasingly be hit by exchange rate movements, therefore it is something of a surprise to see that activity in spot has actually declined (by $9 billion to $150 billion per day).
Perhaps more pertinently, non-financial activity in other products has also declined, with a fractional fall in options turnover ($26.6 billion from $27 billion) and outright forwards ($94.7 billion from $116 billion), suggesting that hedging activity has declined across the board. FX swaps activity with non-financials has also declined, from $166 billion to $147.9 billion in the latest report.
Overall, the survey offers a few surprises in terms of the demographics, for while there were expectations of a decline in hedge fund and PTF activity thanks to a harsher credit environment and what is seen as an unwillingness to engage with these firms by an increasing number of banks (except as a PB), the resources thrown at the real money segment would suggest that the market expected stronger growth than that seen.
While the FX industry can point to another impressive number to demonstrate its size, the client data may make for more sober reading, suggesting that in terms of the segments most precious to the market makers, activity is flat-lining
Customer activity over the three-year period rose by just $22.3 billion across all FX products, a bare fraction of the pace of growth seen over the past decade and more, however there are quirks of the report that mean, in the banking sector especially, the situation for sales desks is not as flat as it seems.
It is important to note that the BIS’ definition of Reporting Dealers is quite broad and based upon local conditions. This means that a fair chunk of the volume in this data bucket is actually from banks with local or regional strengths and who still rely upon the top tier of banks for a lot of their liquidity.
While the FX industry can point to another seriously impressive number to demonstrate both its size and growth, the client data may make for more sober reading, suggesting that in terms of the segments most precious to the market makers, activity is flat-lining. This is not necessarily bad news, the FX market now has crypto as a competitor for institutional money – and hedge funds especially – and as such sustaining such high levels of business is a positive. It can also be argued that many firms already had their hedges on before April and that contributed to subdued growth (although most jurisdictions reported activity steady from the previous six months).
Either way, with buy side activity seemingly flattening out the competition for this business is only likely to grow further – and that is probably good news for clients – or at least those who take their FX execution seriously.
