Japan FX Turnover Flat in October
Posted by Colin Lambert. Last updated: February 8, 2022
Following a delay in publication the Tokyo Foreign Exchange Committee has completed the latest round of FX committee semi-annual turnover surveys, reporting that Japanese market activity was slightly down on April 2021, but up year-on-year. This largely reflects the other regional committee reports, aside from Singapore, which registered stunning growth.
Overall turnover in Japan was $444.3 billion per day in October, down from $448.2 billion in April (which was the highest ever recorded by the centre), but up 4.4% year-on-year.
FX swaps remain the biggest market in Japan, with ADV of $245.1 billion, this is an increase on April ($234.4 billion) and October 2020 ($223.9 billion). Spot activity was $135.5 billion, down from $138.9 billion in April and also down year-on-year, from $138.2 billion in October 2020. Outright forward activity reflected the broader trend, dropping from April’s $63.3 billion to $52.4 billion, but up on October 2020’s $51.5 billion.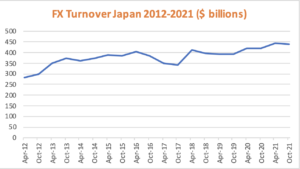
In the derivatives space, FX options turnover was $8.1 billion per day, up from $7.3 billion and $6.8 billion in April and October 2020 respectively, while currency swaps turnover dropped to $3.1 billion from $6 billion in October 2020 and $4.3 billion in April 2021.
The majority of turnover (84%) in Japan is with financial institutions and activity was up with this sector in spot, FX swaps and options compared to April and October 2020. The majority of this activity (again 84%) was with interbank dealers as categorised by the Tokyo committee.
Contrastingly, non-financial activity was lower across the board, with only outright forwards registering an increase on either April or the previous October.
With the Tokyo data now in, Asia’s position in the FX market, largely thanks to Singapore’s growth, continues to improve. The four centres to report, indicates average daily turnover in the time zone approaching $2 trillion, almost double that in North America and not far off the UK’s dominant position ($2.7 trillion per day in the latest survey). Just four years previously (when Hong Kong started to report semi-annual data), Asia-Pacific turnover was $1.36 trillion per day.