FX Turnover Declines in October: Singapore Sees Stunning Growth
Although there has been a delay in the publishing of the data from Japan, the latest round of FX committee FX turnover data indicates that activity dropped from April 2021, but remains significantly higher that October 2020.
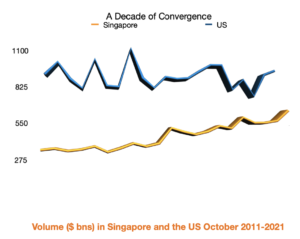
Turnover dropped in all centres except for the US and Singapore, the latter of which saw a staggering 24.1% increase in activity over April 2021 – US activity was up a more modest 2.3%. The Singapore result stands in stark contrast to declines in the UK (-7.6%), the Hong Kong (-1.2%), Australia (-3.6%) and Canada (-2.4%).
What makes the Singapore data even more eyebrow-raising is how the centre saw a sharp decline in FX derivatives activity, which almost halved over the six months from April as currency swaps turnover collapsed from $73.4 billion in April 2021 to just $5.9 billion in the latest survey. Historically, turnover in this instrument has been in the $60-80 billion per day range, suggesting that the October 2021 result could be even more outlier than it initially seems.
The growth in Singapore was across the board with spot turnover rising from $133 billion in April to $166.1 billion in October, also representing a 36% year-on-year rise. This may be evidence that the Monetary Authority of Singapore’s initiative to attract more e-FX flow to the centre is starting to gain serious traction. Elsewhere, activity in outright forwards rose from $89.6 billion in April to $136.2 billion in October, this also represents a more than doubling in activity from October 2020.
FX swaps, long a strong suit of the Singapore market saw activity rise by 39.3% from April to October 2021, coming in at $438.5 billion – this also is a serious gain, of 54.4%, on October 2020’s data. Finally in a very strong report for the city state, FX options turnover in Singapore rose from $29 billion in April to $47.5 billion in October 2021 – a 45.7% increase on October 2020.
In total monthly volume terms, and taking into account there was one more working day in October than April 2021, spot markets’ growth was led by USD/JPY, activity in which soared by over 28% from April, although there were notable gains in USD/SGD and EUR/USD, of around 11-13%; and AUD and CAD against the dollar, the former rising 17%, the latter 36%. Gains were registered across the board in outright forwards, led by AUD/USD total monthly volume of which rose by almost three times to $119.9 billion per day. Growth was also evident across the board in FX swaps, again though, USD/JPY (+64.6% from April) and AUD/USD (+49.9%).
UK Turnover Declines
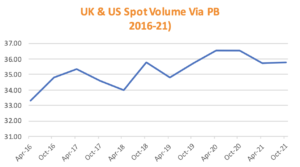
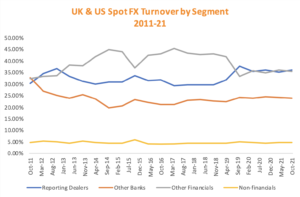
Elsewhere, the world’s largest FX centre, the UK, saw average daily volume of $2.757 trillion, down from $2.985 trillion in April – a new high water mark for the centre – but up 6.8% year-on-year. Spot FX turnover dropped by 9.6% from April to $729.8 billion, however this is up 3.4% on the previous October. Spot activity dropped across all counterparty segments from April, but were more positive year-on-year. Compared to October 2020, spot activity between Reporting Dealers rose 3.9% to $309.8 billion per day; with Other Banks it actually dropped a fraction, from $154.9 billion to $153.3 billion; with Other Financial Institutions it rose by 5.1% to $239 billion; and with Non-Financial Institutions it was up from $25.3 billion to $27.7 billion in the latest survey. The percentage of activity via prime brokers actually dropped slightly year-on-year, from 47.1% to 45.2% in October 2021 – a notional value of $331.2 billion per day.
Good news for those platforms that launched NDF trading in 2021 comes in a solid rise in activity in the UK. Turnover averaged $126.7 billion per day in October 2021, up slightly from April ($124.3 billion), but up 17% year-on-year. The data suggest that it is better to be in the inter-dealer space in this market, with almost three-quarters of volume being executed between Reporting Dealers or Other Banks – the largest growth came from the latter, activity rising to $23.2 billion from $12.8 billion in October 2020. Reporting Dealer activity was $70.6 billion (up 4% year-on-year) while volume with Other Financial Institutions ($19.6 to $23.4 billion) and Non-Financial Institutions ($8 billion to $9.5 billion) also saw an increase.
Outright forwards activity rose in the UK, both from April 2021 (+1%) and October 2020 (+15.2%), driven, on a year-on-year basis, largely by activity between Reporting Dealers (+32.4% to $117.6 billion per day) and Other Financial Institutions (+22.9% to $166.3 billion). Turnover with Other Banks dropped by 37% to $29.3 billion, Non-Financials’ activity was broadly unchanged at $13 billion, up from $12.4 billion.
In the UK’s biggest market, FX swaps, activity dropped from April 2021, by 9.3% to $1.428 trillion, but was up by 7.2% year-on-year. Perhaps reflecting the increasing concern about monetary policy developments globally, activity in FX swaps was up, on a year-on-year basis, across all counterparty segments, by 7.2% to $783.1 billion with Reporting Dealers; by 6.2% to $432 billion with Other Banks; by 9.1% with Other Financial Institutions to $161.9 billion; and by 8.3% to $51.3 billion with Non-Financial Institutions.
Activity in FX options continues to lag in the UK, turnover declining both from April, by 7.8% and October 2020, by 7.5%, to $117.9 billion. In a reverse of the data in outright forwards, in FX options the decline was seen in activity with Reporting Dealers (down 4.8% to $61.6 billion), and Other Financial Institutions (down 15.1% to $38 billion). Other Banks and Non-Financials’ activity was very slightly higher at $12.5 billion and $5.7 billion respectively.
US On the Up
As noted, the New York Foreign Exchange Committee’s turnover report was the only one, other than Singapore so show an increase from April. On a year-on-year basis activity was up 6%, driven by good increases in spot and swap activity. Again, FX options turnover was lower, however, albeit by just 0.4%.
Spot FX volumes were $399.1 billion per day in October 2021, up 7.1% on October 2020. The increase was across the board in terms of counterparties, with Other Financial Institutions leading way with an 8.8% increase to $162.2 billion – the single largest segment in the US spot market, thanks to the proliferation of non-bvank market makers in the centre – while Reporting Dealers ($96 billion), Other Banks ($109.5 billion) and Non-Financial Institutions ($25.1 billion) also saw increases in the 5-7% range. Prime brokerage volumes dominate the US market, again a reflection of the non-bank market maker activity, ADV of $332.6 billion representing 83.3% of activity, up from 80.2% in October 2020.
Outright forward activity rose slighty in the latest report, to $186.4 billion from $184 billion, the only notable changes being a drop of around $8 billion in activity with Other Banks to $21.8 billion, which was made up for a commensurate rise in turnover with Other Financial Institutions to $119 billion. Volume with Reporting Dealers ($21 billion) was unchanged and with Non-Financials it rose $2 billion per day to $24.5 billion.
NDF activity in the US was $45.9 billion, this is largely in line with the data for the past seven-plus years, albeit at the lower end of the $45-50 billion range over that time.
FX swaps volume was $358 billion per day, up from $330.7 billion in October 2020, and while activity with Reporting Dealers (down 2.9% to $99.6 billion) and Non-Financial Institutions (down 5% to $20.9 billion), these declines were more than made up for by Other Bank (+4.3% to $138.3 billion); and Other Financials (up an impressive 34.8% to $99.3 billion).
As noted, FX options activity at $45.9 billion is fractionally lower than October 2020, a $3 billion per day increase in activity with Reporting Dealers (to $11 billion) was offset by a similar drop with Other Financials (to $14.9 billion), while Other Banks dropped slightly to $15.1 billion, while Non-Financials increased to $4.8 billion per day.
Mixed News
Elsewhere, with Japan still to report, the news was more mixed. From April 2021 each of Australia, Canada and Hong Kong saw a small decline in activity, but on a year-on-year basis only Australia was lower, largely thanks to a decline in FX swaps volumes.
The Australian Foreign Exchange Committee reports turnover of $134.4 billion, down 3.6% from October 2020. Spot activity in Australia actually rose from April, but at $40.2 billion per day, it was down 7.1% year-on-year. Outright forwards turnover was $18.7 billion, down slightly from April but up 34.8% year-on-year. As noted, FX swaps activity declined to $71.8 billion, down 8% on both April and October’s reports. Currency swaps activity was also slightly lower at $2.5 billion (from ($3.4 billion), however FX options volumes popped higher to $1.2 billion, up from $865 million in October 2020.
Elsewhere, the Canadian market managed to hold on to most of the gains it recorded in the April 2021 survey, turnover coming in at $153.4 billion, slightly down from April’s $157.2 billion but up 22.9% year-on-year. The majority of the gains came in FX swaps ($112.2 billion vs $92.9 billion), however this was a drop from April. Spot volumes was $18.5 billion in October 2021, versus $13.7 billion in October 2020, while outright forward activity was $15 billion, up from $11.4 billion the year before. Derivatives activity was also higher, currency swaps volumes up from $3.4 billion to $3.9 billion, and FX options turnover rising to $3.7 billion from $3.4 billion in October 2020.
Only non-reporting banks saw a decline in share of the market in Canada, although at 63.8% it remains the largest counterparty segment, within the Other Financial Institution segment, Institutional Investors was the largest segment with 55.6% of the $23.9 billion per day executed in Canada, this was down, however, from 70% in October 2020. The share of Hedge Funds and other prop trading firms rose to 25.5% of Other Financials volume (from 23.9%).
Finally, Hong Kong reports turnover of $582.7 billion in October 2021, down slightly from April but up 3.2% year-on-year. Only the largest product set in Hong Kong, FX swaps, saw a decline in activity on a year-on-year basis, activity falling to $347.5 billion from $362.1 billion.
Elsewhere, spot activity was $100.3 billion, up slightly from $99.4 billion, while outright forwards saw a strong rise to $71.9 billion from $51.7 billion, and FX options activity was $20.2 billion per day, up from $16.5 billion. Currency swaps turnover also rose, from $33.9 billion per day in October 2020, to $42.7 billion in the latest report.
Although the Japanese data tends to be fairly consistent, a global view is impossible without hard numbers. Assuming the centre saw unchanged activity levels, however, global turnover would be slightly lower, by some 1%.
Attention now turns to the impending triennial global survey due to be conducted in April 2022 by the world’s central banks for publication by the Bank for International Settlement in September of this year.

