What Happened at the Month End Fix?
Posted by Colin Lambert. Last updated: February 2, 2022
After a quiet year-end in terms of potential market impact cost at the London 4pm Fix, there was a return to trend at the end of January, with the longer Siren window creating significant savings over the shorter WM fixing period.
The average saving by using the longer window was $676, slightly below the average over the first 10 months that The Full FX has been publishing these data of $756.20 per month end. The headline act in terms of potential savings was AUD/USD at a massive $1,191 per million traded, although NZD ($943), JPY ($789) and Cable ($760) all provided significant potential savings, the latter two being heavier traded markets, as such the actual dollar number likely to be much, much higher.
The data tables below offer a comparison with data delivered by Raidne, which owns the Siren Fix. The Full FX has independently verified that the WMR data, which is calculated from New Change FX data by Raidne, reasonably reflects the month-end rates delivered by WMR.
To provide more context, the table also presents projected dollars per million savings across a portfolio of different pairs using a correlation with the Fix calculation, depending upon how much flow was in the direction of the market, or “with the wind”.
| January 31 |
| CCY Pair | WMR 4pm Fix* | Siren Fix | 100%** | 80% | 70% | 60% |
| EUR/USD | 1.1210 | 1.12089 | $98 | $59 | $39 | $20 |
| USD/JPY | 115.225 | 115.316 | $789 | $473 | $316 | $158 |
| GBP/USD | 1.34165 | 1.34267 | $760 | $456 | $304 | $152 |
| AUD/USD | 0.70455 | 0.70539 | $1,191 | $714 | $476 | $238 |
| USD/CAD | 1.2718 | 1.27271 | $715 | $429 | $286 | $143 |
| NZD/USD | 0.65674 | 0.65736 | $943 | $566 | $377 | $189 |
| USD/CHF | 0.93106 | 0.93058 | $516 | $309 | $206 | $103 |
| USD/NOK | 8.91605 | 8.92135 | $594 | $356 | $238 | $119 |
| USD/SEK | 9.33415 | 9.32972 | $475 | $285 | $190 | $95 |
| Average | $676 | $405 | $270 | $135 |
*According to Raidne calculation using NewChange FX data
** Savings are in dollars per million by percentage of correlation to the Fix flow. Blue cells signify a projected saving using Siren, Red cells a saving using WMR
EUR/USD, as has been the case reasonably regularly in this analysis, was the pair with lowest potential savings, at just $98 per million – that said on a multi-billion dollar portfolio even at the 60% correlation, $20 per million is a sizeable amount. The low EUR/USD number reflects market depth in the pair, although this should not be taken for granted, given how the pair is responsible for the second highest potential saving in the last 10 months at $2,375 per million in November.
Although the Cable savings at $760 were significant they were actually a little below the 10-month average of $909 per million, possibly helped by a recovery in the pair after a first bout of pre-hedging some 12 minutes before the WM window opened. A second spell of pre-hedging in the five minutes into the Fix meant that, as often happens, a currency pair hit the high/low in the WM window, before, in this case, bouncing some 20 points immediately after.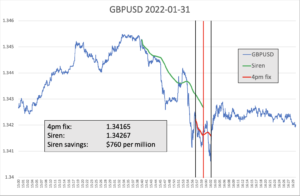
Every month The Full FX is selecting an emerging market currency pair at random to broaden the analysis – this month the selected pair is USD/MXN. Data is again provided by Raidne according to the same guidelines in place for the regularly reported currency pairs.
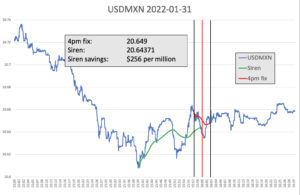
Although it was a quiet currency pair picked this month, USD/MXN still saw a steady bid tone into the WM window – the market traded flat in the immediate aftermath of the Fix, meaning a not insignificant saving of $256 per million could have been achieved using the longer window.