FX Turnover: A Tale of Two Centres
Posted by Colin Lambert. Last updated: August 16, 2022
Ahead of the release of the eagerly-awaited Bank for International Settlements’ Triennial Survey of FX Turnover, The Full FX is taking a look at different aspects of the regional surveys, taken in the same month – in this article, execution channels
The execution data from the UK and US surveys – the only two local FX committees to provide such data in any detail – very much presents a tale of two centres going in different directions. It should be noted that the two committees report data in a slightly different fashion, but nonetheless, customer behaviour in the two centres has diverged quite starkly.
In the UK, across all FX products, compared to April 2021, Other Financial Institutions (OFI) have turned away from the single dealer platforms (SDPs) as well as the electronic broking systems in favour of the multi-dealer venues/aggregators (MDPs). In the US, by contrast, OFIs increased their volume via the SDPs to the detriment of their multi-dealer brethren – activity on the ECNs is also lower.
This could simply be a reflection of liquidity in what was a torrid month for global markets – typically liquidity is deeper in markets during the UK days and drifts off once the US has the FX market to itself for its afternoon. In those circumstances – and against a background of sluggish volume growth in the US report more generally – customers are more likely to go for the more robust liquidity and pricing available from a single dealer.
Interestingly, the exact opposite occurred in the Non-Financial Institution (NFI) category of the reports, with these firms, typically corporates, drifting away from the MDPs in the UK (a 6% drop in market share) towards the SDPs, while in the US they went for the MDPs (a 20% market share increase) over the SDPs. While this would seem to contradict the earlier point about liquidity in US markets, it is more probably the function of firms that trade according to a programme and policy, compared to those seeking to squeeze every last dollar out of their execution. NFIs are also, more typically, easier to quote than OFIs, thus the dealers themselves are probably content to meet them in competition than the more professional counterparties.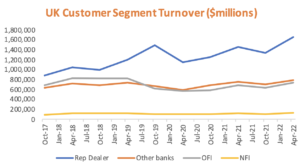
Perhaps the most attention-grabbing statistic from the UK report however, has little or nothing to do with electronic trading – and that is the channel responsible for the most volume in FX markets every day. From third place in the April 2021 report, inter-dealer brokers – thanks almost exclusively to FX swaps activity, is the number one channel for FX trading in the UK in April 2022. At $890.2 billion per day (23.1% of all volumes), the brokers have overtaken the Inter-Dealer Direct ($749 billion and 19.5%) and Customer Direct ($619.8 billion and 16.1%) channels.
In the US, by contrast again, the Voice Indirect channel, which represents the brokers, beats only the SDPs in terms of volume and market share.
Segmentation
In terms of client segments and their preferred channels, in UK, the Customer Direct avenue remains the most popular with Other Banks, with $214.3 billion per day (29.6%) of all FX trading going via this route. The brokers are second, at $209.3 billion (28.9%) – again reflecting increased activity in FX swaps, while electronic broking/ECNs is the next in line at $120.3 billion (16.6%), with MDPs ($72.5 billion, 10%) just pipping SDPs ($69.6 billion, 9.6%) to round the report out.
For the first time since the pre-pandemic April 2019 report, however, Other Banks are not the second largest sector in the UK market after the Reporting Dealers, for OFIs have resumed the position they held for the previous five years’ worth of reports. OFIs preferred channel in April 2022 was also the Customer Direct avenue, with ADV of $219.7 billion (29.5%). MDPs are the next preferred with $174 billion (23.3%), followed by the ECNs at $148.4 billion (19.9%) and SDPs at $110.8 billion (14.9%). Compared with the April 2021 data, the MDPs saw an increase in market share from 18.1%, however the other channels all saw a decline, ECNs from 23.4%, SDPs from 19.3% and Customer Director, slightly, from 30.1%.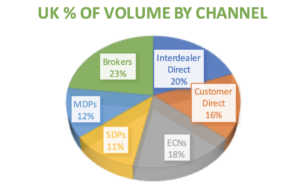
NFIs remain committed to the Customer Direct channel also, with $43 billion per day going that route (32.8%), however this is actually a small market share drop from April 2021, when it was at 33.7%. Volume via ECNs rose to $20.7 billion from $17.2 billion in April 2021 (15.8% from 14.7%); SDPs from $18.8 billion to $21.2 billion (16% to 16.2%); and MDPs actually saw daily volume drop to $25.9 billion from $29.7 billion the year before (25.3% to 19.8%).
In the US report, and again in contrast to the UK, Voice Direct, the closest channel to Customer Direct, is not the most popular, however it is active. Other Banks executed 76.3 billion per day via this route, up from $70.1 billion the year before (a 26.9% of this segment’s volume compared to 23.7% in 2021); and OFIs $92.7 billion from $90.6 billion (26.2% from 24.7%).
NFIs, in contrast, used this channel less, as noted earlier, executing $20.8 billion per day, down from $24.6 billion in April 2021, a market share of 24.6% down from 34% for the channel in this customer segment.
While the MDP channel remains the most popular in the US, the data was broadly lower year-on-year. Other Banks executes $64.2 billion per day, slightly lower than in April 2021 by some $1.7 billion, but actually a higher market share compared to the previous year (22.7% from 21.1%). OFIs traded $119.1 billion per day, also down quite considerably from the $142.6 billion in April 2021 (market share 33.7% from 38.8%), while NFIs executed $29.5 billion, up sharply from $10.4 billion the year before and a market share increase to 34.8% from 14.4% for this channel.
The ECNs were broadly stable in terms of market share, Other Banks executing $51 billion daily from $55 billion (market share 18% from 18.6%), while OFIs traded $81.2 billion from $83.4 billion (22.9% from 22.7%). Only NFIs saw anything like a significant shift, trading $8.6 billion daily from $10 billion (10.1% from 14%).
It is likely that the April 2022 reports from the FX committees offer several outliers, thanks to market conditions in the survey month, and that in October, or more pertinently, next April, if markets have calmed somewhat, a very different picture will be presented. This is not necessarily the case with the BIS survey, for while it is expected to establish a significantly higher daily volume benchmark for FX markets, its three-year cycle means spikes tend to be ironed out.
That said, it is clear that – as often happens in these circumstances – any FX business built around volume had a very good April, and has probably continued that trend.
Perhaps the most enlightening aspect of these reports is how customers behave completely differently depending upon the time of day. The UK has always attracted more volume during its opening hours, but it seems that clients, especially financial professionals, are happy to maintain their LPs in a competitive landscape rather than go direct. That said, those very same dealers are clearly more comfortable quoting and trading in the European hours in competition.
In the US, where things can get tricky and the non-bank market makers typically have more sway in the spot markets, the opposite seems to have occurred, with the dealers only providing their liquidity in competition to non-financial customers.
Whether this contrast in market structure continues can only be seen in the coming reports, but for now it does seem as though heightened volatility serves to exacerbate existing trading channel biases.