What Happened at the Month-End Fix?
Posted by Colin Lambert. Last updated: September 7, 2024
The run of relatively subdued month-end FX fixes, in terms of market impact, continued in August, although savings were still considerable at over $250 per million for those using a longer calculation window, and much higher than in July.
For the second month in a row, the potential savings from using the Siren FX Fix, compared to the WM Fix, were below the 41-month average since The Full FX started publishing the data, although it is notable that the largest market, EUR/USD provided potential savings of $298 per million, above the portfolio average, when using the 20-minute Siren window, compared to the five-minute WM. Although low compared to historical averages, this is still the second largest potential saving registered thus far in 2024.
The biggest execution cost for the shorter window was in another major FX market, Cable, with the pair offering $365 per million in savings – also the second highest this year, followed by USD/SEK, and the Australian and New Zealand dollars, all of which were over $300 per million.
The average saving across the portfolio of nine currency pairs was $269 per million, substantially below the 41-month average of $617.80 per million.
Interestingly, after a period of divergence, checks made by The Full FX indicate that the synthetic WM rates generated from the higher frequency data from New Change FX, were close to those from WM.
| August 30 |
| CCY Pair | WMR 4pm Fix* | Siren Fix | 100%** | 80% | 70% | 60% |
| EUR/USD | 1.10695 | 1.10728 | $298 | $179 | $124 | $62 |
| USD/JPY | 145.601 | 145.562 | $268 | $161 | $107 | $54 |
| GBP/USD | 1.3143 | 1.31478 | $365 | $219 | $146 | $73 |
| AUD/USD | 0.67847 | 0.67868 | $309 | $186 | $124 | $62 |
| USD/CAD | 1.34778 | 1.34752 | $193 | $116 | $77 | $39 |
| NZD/USD | 0.62563 | 0.62582 | $304 | $182 | $121 | $61 |
| USD/CHF | 0.84839 | 0.84822 | $200 | $120 | $80 | $40 |
| USD/NOK | 10.59328 | 10.5915 | $168 | $101 | $67 | $34 |
| USD/SEK | 10.24123 | 10.24445 | $314 | $189 | $126 | $63 |
| Average | $269 | $161 | $108 | $54 |
*According to Siren FX calculation using NewChange FX data
** Savings are in dollars per million by percentage of correlation to the Fix flow. Blue cells signify a projected saving using Siren, Red cells a saving using WMR
As noted, the largest execution cost was in Cable, and although price action was bumpy, there was visible downward pressure on the pair from 15 minutes out of the opening of the WM window – typically the time when hedging ahead of the Fix commences. Although there were three reversals, Cable entered the WM window some 20-plus points lower than it was 15 minutes before. Interestingly, however, after an initial sell-off, price action, while again choppy, seemed to be biased to the upside.

Source: Siren FX
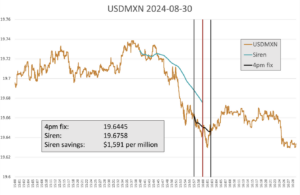
Every month, The Full FX is selecting an emerging market currency pair at random, and before the data is available, to broaden the analysis – this month the selected pair is USD/MXN. Data is again provided by Siren FX according to the same guidelines in place for the regularly reported currency pairs.

Source: Siren FX
In USD/MXN, there was again selling pressure some 15 minutes out from the WM open, however, it accelerated into that open, the pair dropping some five big figures in the last five minutes. In what could be viewed as a classic fixing move, the selling continued in the early part of the window, before there was a late reversal, often prompted by speculators squaring up as the WM flow slows.

