What Happened at the Month-End Fix?
Posted by Colin Lambert. Last updated: November 6, 2023
The pattern of lower market impact at the month-end FX fix continued in October, with potential savings from using the longer, 20-minute, Siren fixing window, as opposed to the five-minute WM calculation, still below the longer-term average – although using the longer calculation savings still approached $500 per million – largely in line with the savings available in September.
That consistency is, perhaps, the real story emerging from the Fix comparison in 2023. Whereas before there were reasonable wide swings in potential savings on offer, thus far in 2023, the savings have largely been in a relatively narrow range. While this has seen most months this year offer savings below the 31-month average since The Full FX starting publishing data, it has provided an accurate picture, wherein users of the longer calculation – which generally speaking takes in the (pre)hedging window of the executing banks – can be confident they will realise market impact savings in the $500 per million range.
This is reflected in the $493 per million savings from the Siren window, with the majority of currency pairs evaluated providing a lower saving than both their longer term average and the average through 2023 – the latter however, by a much smaller margin,
Impact was above average in just USD/CHF, which was the second highest since September 2022 at $814 per million, while it was at its lowest (again compared to the longer-term average) in EUR/USD – one can only think what EUR/CHF traders made of this.
To provide more context, the table also presents projected dollars per million savings across a portfolio of different pairs using a correlation with the Fix calculation, depending upon how much flow was in the direction of the market, or “with the wind”.
| October 31 |
| CCY Pair | WMR 4pm Fix* | Siren Fix | 100%** | 80% | 70% | 60% |
| EUR/USD | 1.05696 | 1.05718 | $208 | $125 | $83 | $42 |
| USD/JPY | 151.445 | 151.49 | $297 | $178 | $119 | $59 |
| GBP/USD | 1.21345 | 1.21288 | $470 | $282 | $188 | $94 |
| AUD/USD | 0.63315 | 0.63281 | $537 | $322 | $215 | $107 |
| USD/CAD | 1.38819 | 1.38792 | $195 | $117 | $78 | $39 |
| NZD/USD | 0.58165 | 0.58129 | $619 | $372 | $248 | $124 |
| USD/CHF | 0.91005 | 0.90931 | $814 | $488 | $326 | $163 |
| USD/NOK | 11.1717 | 11.18011 | $752 | $451 | $301 | $150 |
| USD/SEK | 11.17265 | 11.17869 | $540 | $324 | $216 | $108 |
| Average | $493 | $296 | $197 | $99 |
*According to Siren FX calculation using NewChange FX data
** Savings are in dollars per million by percentage of correlation to the Fix flow. Blue cells signify a projected saving using Siren, Red cells a saving using WMR
For a change, this month we are presenting graphical data on a pair not included in the regular monthly analysis, EUR/GBP.
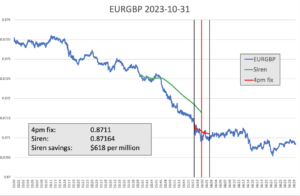
Source: Siren FX
Although the actual move in the market is not huge, the points are worth quite a lot and there was a notable move in the time leading up to the WM window opening, suggesting there was significant hedging ahead of that opening taking place. The EUR/GBP move looks to be a reflection of a natural imbalance in the market, unlike what often happens in such circumstances, there was no real reversal as speculators took profits towards the end of the WM fixing window – also the market continued to hover around the lower levels post-Fix. This offered a $618 per million saving, which is not insignificant in a pair not noted for extreme volatility on a daily basis.
Every month, The Full FX is selecting an emerging market currency pair at random, and before the data is available, to broaden the analysis – this month the selected pair is USD/CZK. Data is again provided by Siren FX according to the same guidelines in place for the regularly reported currency pairs.
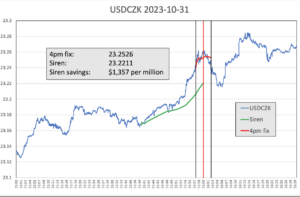
Source: Siren FX
Again, there was steady dollar buying in the 15 or so minutes ahead of the WM calculation window opening, but unlike in EUR/GBP, the pattern of trading was more familiar. Although the pair popped higher at the start of the five-minute window, it reversed, likely as speculators took profit, and exited the window roughly where it started, suggesting most of the buying was done ahead of the window and the execution path was successfully smoothed.
Also a regular feature of this analysis, the reversal towards the end of the window continued after WM’s calculation period closed, although there was another bounce some five minutes later. This suggests that either the dollar amount was over-bought into the WM window, which is unlikely, or speculators jumped on early signs of hedging ahead of 15.57.30GMT.
The overall saving for the emerging market pair, at $1,357 per million, was some $160 per million above the 30-month average since The Full FX started publishing data on an EM pair.