What Happened at the Month-End Fix?
Posted by Colin Lambert. Last updated: October 6, 2023
It was another quieter than average month-end FX benchmark Fix in September, with the good news being that two of the major pairs, Cable and USD/JPY, providing their lowest execution cost from using the five-minute WM window, compared to the 20-minute Siren window, since The Full FX started publishing this data in April 2021.
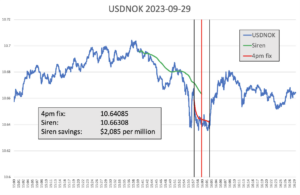
The less good news was for anyone in the Scandies, where it was a bit of a bloodbath for those using the shorter window. USD/NOK is a repeat offender in these stakes, even here, the saving of $2,085 per million was only the third highest, while USD/SEK had the fifth highest market impact over those 30 months.
The overall saving was $531 per million – still a substantial saving of course – but this is below the long-term average of $671.50. 2023 has seen lower market impact for the shorter window, with just two of the nine months providing portfolio savings over the long-term average.
In September, Cable came closest to providing some red ink on the table below for only the third time since publication started (the previous times being USD/CAD in October 2021 and AUD/USD in June 2021), providing a saving of just $8 per million by using the longer window. Likewise, USD/JPY also provided its lowest saving at $47 per million, undercutting the previous low of $54 per million in May 2022.
With EUR/USD also providing below trend savings – but still $255 per million – it was certainly a better month for WM users, although it would be interesting to hear what asset owners and trustees thought about leaving over $250 per million on the table!
| September 29 |
| CCY Pair | WMR 4pm Fix* | Siren Fix | 100%** | 80% | 70% | 60% |
| EUR/USD | 1.05873 | 1.05846 | $255 | $153 | $102 | $51 |
| USD/JPY | 149.226 | 149.219 | $47 | $28 | $19 | $9 |
| GBP/USD | 1.22058 | 1.22057 | $8 | $5 | $3 | $2 |
| AUD/USD | 0.64537 | 0.64561 | $372 | $223 | $149 | $74 |
| USD/CAD | 1.35196 | 1.35183 | $96 | $58 | $38 | $19 |
| NZD/USD | 0.60088 | 0.60108 | $333 | $200 | $133 | $67 |
| USD/CHF | 0.91479 | 0.91446 | $361 | $217 | $144 | $72 |
| USD/NOK | 10.64085 | 10.66308 | $2,085 | $1,251 | $834 | $417 |
| USD/SEK | 10.86415 | 10.87741 | $1,219 | $731 | $488 | $244 |
| Average | $531 | $318 | $212 | $106 |
*According to Siren FX calculation using NewChange FX data
** Savings are in dollars per million by percentage of correlation to the Fix flow. Blue cells signify a projected saving using Siren, Red cells a saving using WMR
As noted, USD/NOK saw the biggest savings in September, with much of the dollar selling appearing to take place ahead of the WM window. There was, however, some relief with a bounce just ahead of the WM window opening, however this was quickly reversed in the opening seconds.
Overall, it looks like USD/NOK picked up some dollar buying at the Fix that balanced out the expected selling, indeed the bounce ahead of the window could have been some (pre) hedging, in which case, rarely, the executing broker doing the hedging might have actually lost money on the Fix. Dollar selling was the dominant theme, however, given the bounce as the WM window closed and in the minutes afterwards.

Source: Siren FX
Every month The Full FX is selecting an emerging market currency pair at random, and before the data is available, to broaden the analysis – this month the selected pair is USD/HUF. Data is again provided by Siren FX according to the same guidelines in place for the regularly reported currency pairs.
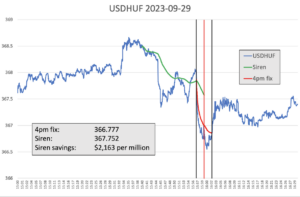
USD/HUF often sees market impact around the Fix – it offered up the spectacular blow-up of $3,800 per million in February 2022 (and pairs are selected at random) – and September 2023 was also a rough month for those using the shorter window.
There may have been some hedging ahead of the window, there were a couple of sharp-ish drops, but it looks like the majority of flow was saved for the WM calculation, which led to almost a 150-point drop in the first half of that window. There was the usual rebound towards the end of that window, followed by USD/HUF returning to stability, slightly lower than where it entered the Siren window.

Source: Siren FX
In many ways, price action in USD/HUF explains why a longer window could help smooth out market impact. It seems clear that the amounts being traded swamped liquidity at the start of the window – the same was seen in USD/NOK – leading to spec interests no doubt piling into the position, helped by information leakage. It could be argued that a longer window would not have seen this price action, as indicated by the more-than $2,100 per million saving.


