What Happened at the Month End Fix?
Posted by Colin Lambert. Last updated: July 6, 2023
The end of Q2 2023 was a relatively subdued affair around the London 4pm Fix, with the potential savings measuring execution over a longer window at their lowest level since The Full FX started tracking this data in April 2021.
The overall saving across a portfolio of nine currency pairs was $217 per million – still a significant saving, especially when the two largest savings are in the world’s two most traded currency pairs, EUR/USD and USD/JPY. The former offered a potential saving of $376 per million by using the Siren FX 20-minute window, as compared to the five-minute WMR calculation window, while the savings were a fraction higher in USD/JPY at 381 per million.
All pairs calculated were well below their 27-month average, with AUD/USD offering the lowest saving over that time horizon, at $45 per million.
There is a suggestion that firms hedging at quarter ends spread their hedging flows out more, or use different channels, several LPs spoken to over the past year have observed that a growing number of customers are aware of their market impact, especially over quarter ends, and try to dilute their execution, while others also observe that the quarter ends attract more corporate hedging flow, which can be counter-trend.
Either way, it is notable that June was the second quietest month in 2021, only the end of Q3 in September 2021 was quieter in terms of savings per million, while in 2022, June was the third quietest month for savings.
| June 30 |
| CCY Pair | WMR 4pm Fix* | Siren Fix | 100%** | 80% | 70% | 60% |
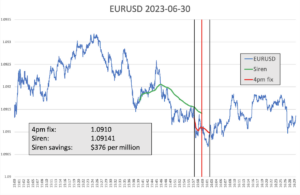
| EUR/USD | 1.0910 | 1.09141 | $376 | $225 | $150 | $75 |
| USD/JPY | 144.535 | 144.48 | $381 | $228 | $152 | $76 |
| GBP/USD | 1.27135 | 1.27145 | $79 | $47 | $31 | $16 |
| AUD/USD | 0.66565 | 0.66562 | $45 | $27 | $18 | $9 |
| USD/CAD | 1.32325 | 1.32345 | $151 | $91 | $60 | $30 |
| NZD/USD | 0.61265 | 0.61286 | $343 | $206 | $137 | $69 |
| USD/CHF | 0.89465 | 0.89448 | $190 | $114 | $76 | $38 |
| USD/NOK | 10.71355 | 10.7106 | $275 | $165 | $110 | $55 |
| USD/SEK | 10.8013 | 10.80249 | $110 | $66 | $44 | $22 |
| Average | $217 | $130 | $87 | $43 |
*According to Siren FX calculation using NewChange FX data
** Savings are in dollars per million by percentage of correlation to the Fix flow. Blue cells signify a projected saving using Siren, Red cells a saving using WMR
In EUR/USD the chart suggests that some executing firms took advantage of a small spike higher some 10-12 minutes before the WM window opened to pre-hedge at a quicker pace, certainly the price action around the start of the pre-hedging window would have sent the wrong signal to speculators looking to jump in early on the move, with the market actually heading higher.
There was still, nonetheless, a 15-point drop in the minutes leading up to the WM window opening and the market hit a low during that calculation, before, as often happens, moving higher into the close as speculators took profit and selling pressures abated. Post-fix, the market reverted to broadly the levels seen earlier that afternoon.
Source: Siren FX
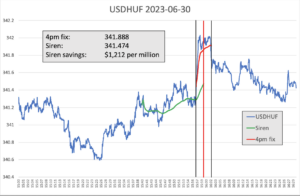
Every month The Full FX is selecting an emerging market currency pair at random, and before the data is available, to broaden the analysis – this month the selected pair is USD/HUF. Data is again provided by Siren FX according to the same guidelines in place for the regularly reported currency pairs.
Source: Siren FX
Activity in USD/HUF was characterised by steady dollar buying into the window, when the pair jumped higher by some 80 points, before holding steady at the highs and then drifting lower post-fix. This suggests very little pre-hedging took place, with most of the activity happening in the five-minute window, causing the large market impact and a cost of $1212 per million for users of the shorter window.
Although below recent highs, this cost per million is just $54-per million above the 26-month average since EM currencies were included in the monthly analysis.