FX Turnover Rises, But Slowly
Posted by Colin Lambert. Last updated: February 5, 2024
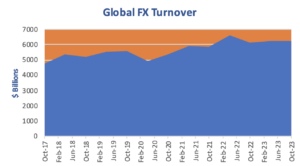
Data released by seven FX committees around the world indicates that the FX market continued to grow through to October 2023, but that the pace of growth has slowed somewhat with some regional variations.
The seven centres report total FX turnover of $6.25 trillion per day, a 2.3% increase on October 2023. Although the data is not directly comparable due to collation differences, at the mid-point between BIS Triennial Surveys, collectively, the local FX committee surveys suggest that FX turnover has fallen by just over 5% compared with the April 2022 BIS report to just over $7.1 trillion per day. It should be noted that the Dollar Index was some 5 points lower in October 2023 compared to the same month in 2022, this would result in a small boost to the volume data on a year-on-year basis.
Of note in the reports, North American markets did well, with the New York FX Committee reporting turnover above $1 trillion for the first time since 2014 and Canada hitting a new peak for daily volume; however the UK saw what is becoming a traditional drop in activity in October compared to April, but it is still up, year-on-year.
In Asia, Hong Kong also hit a new high, while Singapore and Australia edged higher, and Japan was the only centre to see a drop in activity from the previous year.
UK Off the Peak
The UK’s FX Joint Standing Committee reports daily turnover of $2.928 trillion in October, as noted, this is down (by 6%) from April, but is up, albeit fractionally by 1.9%, on October 2022. Spot volumes were the only product group to drop on an annual basis.
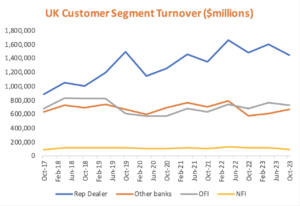
Spot FX turnover in the UK was $862.9 billion per day, making it still, comfortably, the biggest spot market in the world alongside its crown as the biggest FX market more generally. Spot activity was down 4.4% from the previous October, thanks to decreased activity in all counterparty segments with the exception of Other Banks. Activity between Reporting Dealers was down 13.1% at just over $386 billion per day, while customer activity was also lower. Other Financial Institutions’ (OFI) spot turnover was $246.2 billion, a drop of 10.8%, while Non-Financial Institutions’ (NFI) turnover was $24.2 billion, down 34.2%.
As noted, only Other Banks saw increased activity in spot markets, rising by 43.1% to $204.5 billion – the highest turnover with this segment since the data was first reported.
The share of prime brokers in spot also declined slightly to its lowest level since 2016, at 41.8%, it was 45.6% in October 2022.
One of the main growth stories for the UK market in recent years, outright forwards, saw a rise in activity, but was significantly down on the record volume set in the April 2023 report. Turnover was $339.3 billion in October 2023, representing a 10% rise from the previous year. There was actually a reversal of fortunes for the counterparty segments here, with volumes between Reporting Dealers rising 32.1% to $139.4 billion, while Other Banks saw activity drop by 20.2% to $21.2 billion. Activity in outrights with OFIs was slightly higher, by 1.6% to $168.4 billion, while NFI turnover was just $150 million lower at $10.5 billion per day.
Another good story for the UK, NDFs, continued, however, with daily turnover hitting yet another new high at $166.5 billion. This is up 15.8% year-on-year and is the seventh successive time the UK has hit a new peak for NDF trading. As was the case with spot, Reporting Dealers saw a decrease in activity, it remains the largest counterparty segment for NDFs at $80 billion per day however, while all other segments saw an increase. Of particular note was Other Banks’ turnover, which more than doubled to $30.9 billion from $12.9 billion in October 2022.
The UK’s biggest market, FX swaps, remains off recent highs, but saw turnover of $1.35 trillion per day, a 1.5% increase on the previous year. Here, an increase in activity with OFIs of some 2.7% to $208.9 billion, is swallowed by declines in activity between Reporting Dealers as well as with Other Banks and NFIs.
Finally in the UK, FX options activity hit a new high, thanks exclusively, again, to Other Banks. Overall turnover was $173.4 billion per day, up 6% year-on-year, with Other Bank activity showing a remarkably similar profile to NDFs. Turnover jumped to $30.5 billion in the latest survey, compared to just $12.3 billion the year before. There was a small increase in Reporting Dealer activity in options, however both OFI and NFI turnover dropped by some $5 billion per day to $53.7 billion and $6.6 billion respectively.
Overall in the UK on a year-on-year basis, activity dropped between Reporting Dealers and with NFIs, while it rose slightly more with Other Banks and OFIs.
US Going Strong
It was a very good report for the North American market, although it was notable that a large percentage of business was conducted by prime brokers in spot especially – suggesting trading firms’ dominance of the geography is only growing.
Overall activity rose above $1 trillion, to $1.02 trillion to be exact – the first time since October 2014 and only the third time it has been above that threshold. This is a 4.6% increase from October 2022, with all products seeing growth.
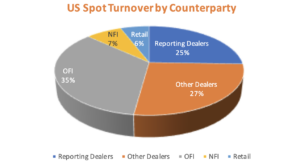
Spot volumes were $436.1 billion, up just over $11 billion per day on October 2022 – growth was shared equally between Reporting Dealers and OFIs, while the other two segments were flat to slightly lower. Most notable in the FXC report was spot prime brokerage volumes of $402.3 billion, meaning spot volume via prime brokers hit an incredible 92.25% in October 2023. For comparison, in October 2018, it was just 65.9%.
Outright forwards’ activity also went up in the US. The FXC includes NDFs in its outrights data, in total the products averaged $192.6 billion per day, up some $14 billion from the previous year, with the growth shared equally between outrights and NDFs. The latter saw volume rise to $53 billion per day – the highest turnover for NDFs since the FXC started reporting the data. Just over 49% of outright/NDF volume was PB-ed in the FXC report, this is also a new high.
It was also a strong month for FX options in the FXC report, with the product segment hitting a new high at $75.6 billion per day – a rise of 18.9%. The growth here was almost exclusively delivered by the client segments with OFI up almost $5 billion per day to $27.3 billion and NFI activity nearly doubling to $13 billion per day from $6.9 billion in October 2022.
Even FX swaps, which has had a patchy past in the FXC report, saw growth in October 2023, rising by almost $8 billion per day to $316.7 billio. As was the case with the headline data, Reporting Dealers and (very slightly) NFIs saw a decrease in activity, with the decline more than made up for by the other two counterparty segments.
Activity in Canada hit a new high, rising 6.6% to $176.8 billion, thanks largely to FX swaps, which jumped to $125.8 billion from $113.9 billion the previous year. Spot activity in the centre was unchanged year-on-year at $19.6 billion, while both outrights ($18 billion from $15.9 billion) and FX options ($4.4 billion from $3.9 billion), saw an increase.
Asia FX on the Rise…Except in Japan
A feature of FX markets over the past decade has been the inexorable rise of Asian centres, while the major western centres have seen an increase it is nothing on the scale of that in Asia. The latest surveys make good reading for firms with strong businesses in the region, although Japan is an outlier on a year-on-year basis.
Turnover in Singapore, which established itself as the largest Asian centre in 2009 and has consolidated its position ever since, showed a modest 0.7% rise from the October 2022 survey at $863.8 billion per day. October 2023 was, however, the second busiest month in Singapore’s history, behind April 2022.
FX swaps continue to be the largest FX product traded in Singapore at $459.6 billion per day, this is up 9.3% year-on-year, while there was also good growth in spot, which registered $216.6 billion, also its second busiest month ever. This represents a 3% increase over October 2022.
The news was less positive in outright forwards and FX options, however, both of which saw a decline in activity from the previous October (although not from the April 2023 survey). Outright forwards turnover declined by 13.1% to $127.9 billion per day, while FX options dropped sharply from the record month in October 2022 to $51.8 billion, a fall of 27.5%.
Hong Kong has also published another strong volume report with overall FX turnover rising to a new peak of $683.8 billion per day, up 15.6% on the year. Within this, spot turnover was $124.5 billion per day, up 6.7%, while outright forwards turnover was $62.2 billion, a rise of 30% year-on-year. FX swaps volumes also hit a new high at $469.2 billion per day, up 29.1%, while FX option activity was $24 billion per day, up 20% from October 2022.
There was a positive report also from the Australian FX Committee, the centre handled $154.3 billion per day in October 2023, up 8.9% on the year. There were mixed fortunes across the product sets, although none had a dramatic shift from October 2022 – in spot turnover was $41.6 billion (-3.4%); in outright forwards it was $21.6 billion (+4.1%); in FX options it was $821 million per day (-43.6%). FX swaps was the main engine for growth in Australia, turnover rising to $86.1 billion, a 16.6% increase.
The outlier, as far as Asia was concerned, was Japan, where the Tokyo FX Committee retained its reputation for eccentric timing of the release by publishing a week early, as opposed to the delayed release often seen over the past few years. In Japan daily turnover dropped quite sharply by 14.9% to $425.7 billion, although it should be noted that October 2022 represented a new high-water mark for the centre.
Activity dropped across the board in Japan, with spot volumes falling by 31.7% to $123.5 billion; outrights by 23.5% to $41.1 billion; FX swaps by a more modest 5.7% to $229.5 billion; and FX options by 30.7% to $10.4 billion.


