FX Turnover Hits New Highs – Over $7 Trillion Per Day?
Posted by Colin Lambert. Last updated: August 10, 2021
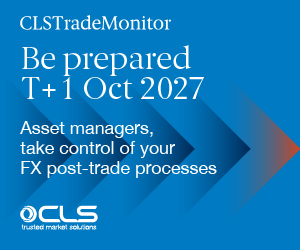
FX turnover surged to a new high in April 2021 according the semi-annual surveys conducted by the seven of the world’s FX committees, driven by new peaks in the UK, Singapore, Tokyo and Canada.
Across the seven surveys, average daily volume (ADV) was $5.926 trillion. This represents an 11.1% increase from the previous survey in October 2020, and a 20.2% rise on April 2020’s data. A significant increase was expected year-on-year as April 2020 was a very quiet month by historical standards as market participants took stock after the initial onset of the global pandemic.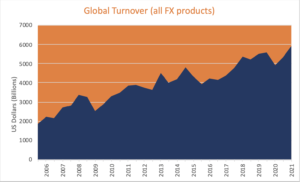
Notwithstanding that, the latest data point still represents a 6.3% increase on the previous high-water mark, set in October 2019. Although some of the regional surveys have different criteria, the data suggest a Bank for International Settlements’ global triennial survey taken in the same month would have registered FX volume over $7 trillion per day – even accounting for the New York FX Committee data including that of Canada, effectively doubling up that centre’s volume.
New Highs for the UK
The UK has built upon its seemingly unassailable position as the world’s largest FX centre, handling $2.985 trillion per day, a 15.6% rise on the previous survey and up 23.8% year-on-year. It is also 3.6% above its previous peak in October 2019. The main drivers were new highs in FX swaps and outright forwards.
Spot ADV was $807.4 billion per day, up 14.4% on the previous survey and up 19.3% year-on-year. While activity has rebounded strongly, spot turnover in the UK remains well below its heights of over $1 trillion per day in 2013. In terms of counterparties, spot activity has recovered to pre-pandemic levels with Other Banks, Other Financial Institutions and Non-Financial Institutions (up 7%, 19% and 15.2% respectively from October 2019), however while it is up year-on-year and from the previous survey, turnover with Reporting Dealers remains slightly below October 2019 levels.
Although turnover via prime brokers hit a new high at $353.6 billion per day, there was a slight decline in the percentage of turnover facilitated by PBs in the UK’s spot markets, it accounted for 43.8% of business, compared to an average around 46% in the previous surveys of April 2021 and October 2020 and 2019.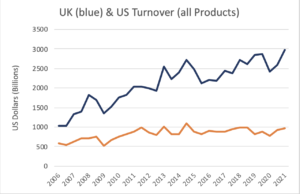
FX swaps activity hit a new peak in April 2021 at $1.575 trillion, which to put its growth into perspective, is higher than all turnover just 11 years ago. Activity is up 18.2% compared to October 2021 and up 23.7% from April 2021. It is also 5.5% above pre-pandemic levels in October 2019, which was the previous high ADV.
In sector terms it was a similar picture to the spot market with activity rebounding from pre-pandemic levels with Other Banks (+17.4%), Other Financial Institutions (+17.6%) and Non-Financial Institutions (+15%), while trading with Reporting Dealers was slightly under that from October 2019.
ADV in outright forwards was $322.8 billion in April 2021, a 14% increase from the previous survey and up 18.7% year-on-year. This also represents a total recovery from pre-pandemic levels, it being a 3.7% increase on October 2019. Although activity was only fractionally higher with Non-Financial Institutions compared to October 2019, the same pattern is seen again with turnover with Other Banks rising a massive 46.6% from October 2019, with Other Financial Institutions’ activity was up 16.9% over the same period. Alone in the survey, turnover with Other Banks was actually down on the previous survey, by 26.9%.
NDF activity was up on the previous two surveys at $124.3 billion per day, by around 14% on each, however it has yet to claw back pre-pandemic levels, being down 5.6% on October 2019. In a reversal of the trend seen elsewhere, only trading between Reporting Dealers was actually up on the October 2019 survey.
Finally in the UK, FX options ADV was $127.9 billion barely changed from the previous two surveys, but 13.6% lower than pre-pandemic levels. Customer activity in options fell sharply from pre-pandemic levels, being down a massive 58.7% with Other Banks, by 11.8% with Other Financial Institutions, and by 38.9% with Non-Financial Institutions. Turnover between Reporting Dealers rose by 10.7%.
US Recovery Continues
While ADV in the US failed to hit new heights, remaining below levels seen in 2013/14 as well as 2018, at $967 billion per day it has rebounded strongly, being 3.6% up on the previous survey, up an impressive 26.5% on April 2020, as well as 8.7% above pre-pandemic levels.
Spot ADV was $384.4 billion, up 3.1% on the previous survey and 18.3% higher year-on-year, activity was higher with all segments compared to the previous two surveys, and compared to pre-pandemic levels, with the exception of Non-Financial Institutions, which fell 10.3%, was up with Reporting Dealers (by 5.4%), Other Banks (+8.1%), and Other Financial Institutions (+11.1%).
Reinforcing the notion that non-bank trading firms are very active in the US, the percentage of spot volume prime brokered, rose fractionally to a new high of 80.56%. Prior to the pandemic, this ratio was climbing steadily and had reached what was then a new high of 77.9% in the October 2019 survey,
Outright forwards activity was $183.4 billion in the US, unchanged from the previous survey but up 19.4% from April 2020. NDF turnover at $48.8 billion is up 6.6% on the previous survey and up 28.7% year-on-year. The US doesn’t break out sector reports for NDFs, but across that product and outright forwards, activity with both Other and Non-Financial Institutions was broadly unchanged compared to pre-pandemic levels, while activity between Reporting Dealers (-23.5%) and Other Banks (-14%) declined. Just under 38% of outright forward and NDF trades were prime brokered, an increase on the 31-33% in the previous three surveys.
FX swaps ADV was $357.1 billion, up 8% from October 2020 and up an impressive 41.8% from April 2020. Only activity with Non-Financial Institutions fell compared to the October 2019 report, by 15.5%, while it soared with Reporting Dealers (+44.4%), Other Banks (+32.8%) and Other Financial Institutions (+19%).
FX options ADV was $41.7 billion, down 9.4% from October 2020, but up 22% year-on-year. While sectoral activity is broadly flat during the intervening period, compared to pre-pandemic levels FX options activity continues to struggle in the US. Turnover is down across the board, with Reporting Dealers by 32.6%, Other Banks by 33.7%, Other Financial Institutions by 27.8% and with Non-Financials by 30.7%.
Overall, compared to pre-pandemic levels in October 2019, US activity is higher in spot (by 7.3%) and swaps (+28.8%), but lower in NDFs (-1.9%), outright forwards (-4.9%) and options (-31.3%).
Asia on the Rise
Asian centres to report continued their impressive growth of recent surveys, with Tokyo and Singapore hitting new highs and Hong Kong reporting ADV second only to what was largely considered an outlier in the April 2019 survey.
Turnover in Singapore average $640 billion per day, the first time the centre has handled volumes above $600 billion. The data will be pleasing to the Monetary Authority of Singapore, which established a goal in 2016 to make Singapore the e-FX centre for Asia, however the Singapore Foreign Exchange Committee report does not break out execution styles, so it is unclear which channels drove the growth.
ADV is up 13.4% on October 2020, up 16.5% year-on-year and an impressive 9.3% higher than its previous peak in April 2019. Spot turnover was $133.1 billion per day, a new high for the city state and up 9% from October 2020. It was also up 7% year-on-year. Outright forwards activity (the SFEMC does not break out NDFs) was $89.6 billion, up 32.3% from the previous survey, and up 26.2% year-on-year, while FX swaps – the dominant product in Singapore – saw ADV of $314.9 billion, a 10.9% and 20.3% rise on the previous two surveys. FX options activity actually decline in Singapore from the previous survey, by 11.2%, but is up year-on-year, by 19.6%. Currency swaps turnover was $73.4 billion, up 26.8% and 7.6% respectively on the previous two surveys.
Compared to pre-pandemic levels, activity is higher across the board, by a massive 56.9% in spot (which suggests the MAS strategy may be reaping rewards), by 25.9% in outrights, by 19.6% in swaps and 4.6% in options.
In Japan, the Tokyo FX Committee reports turnover of $448.2 billion, a new high for the centre and up 5.3% from the previous survey. It is also up 5.6% year-on-year and 9.7% from pre-pandemic levels.
Spot activity was $138.9 billion, slightly up on the previous two surveys and up 9.3% on October 2019, while outright forwards turnover was $63.3 billion, a 14.7% rise on pre-pandemic levels and up roughly the same percentage over the intervening surveys. FX swaps ADV was $234.4 billion, this is up around 4.5% on both previous surveys and 16% higher than pre-pandemic levels.
FX options ADV was $7.3 billion, up on the intervening surveys but down from the $8.2 billion per day in October 2019. The same trend occurred in currency swaps, which, at $4.3 billion fell from $5.8 billion in October 2019 (it was $3.3 billion in April 2020 and $6 billion in the previous survey).
Hong Kong handled $589.6 billion per day in FX products in April 2021, up 4.4% from October 2020 and up 12.6% year-on-year – this is 3.8% higher than pre-pandemic levels. Spot ADV was $107.8 billion, 8.5% higher than the previous survey and up 36.3% both year-on-year and on pre-pandemic levels. Outright forwards ADV was $50.9 billion, a decline from all three previous surveys (pre-pandemic it registered $61.2 billion), while FX swaps turnover rose fractionally from the previous survey, was up 7.3% year-on-year, but down 5% from pre-pandemic levels. Unlike the other surveys, FX options activity, at $20.1 billion, actually rose from October 2020 ($16.5%), April 2020 ($13.5 billion) and pre-pandemic levels in October 2019 ($15.5 billion).
Australia Flat, Canada Jumps
While activity in Canada hit a new high in April, in Australia it remains flat, registering $139.4 billion per day for the third time in the previous four surveys, and unchanged from pre-pandemic levels. There were few changes across products, with spot registering $36.9 billion per day (lower than all three previous surveys and down 5.7% from pre-pandemic activity; while outright forwards at $19.3 billion and FX swaps at $79.6 billion, were broadly steady (outright activity was actually up 16.1% from October 2019).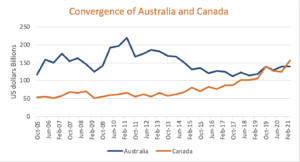
In Canada meanwhile, ADV hit $157.2 billion, around 25% higher than the previous two surveys and up 12.4% on pre-pandemic levels. Spot ADV was $17.3 billion, up on October 2020 ($13.7 billion) but down on both a year-on-year ($18.3 billion) and pre-pandemic ($20.5 billion) basis. Outright forwards activity rose from the previous survey to $13.8 billion per day, but remains steady compared to pre-pandemic levels, while FX swaps turnover was $118.8 billion, a new high for the product and the first time it has risen above $100 billion per day. This represents a substantial 27.9% rise from the previous survey; is up 35.8% year-on-year and is 23.6% higher than pre-pandemic levels.
In FX derivatives, activity was $7.3 billion per day, up on October 2020 ($6.8 billion), but down on both April 2020 ($7.9 billion) and October 2019 ($9.3 billion).