Asia Driving FX Turnover Sustainability
Posted by Colin Lambert. Last updated: February 9, 2021
Perhaps unsurprisingly, given how quiet April 2020 was in FX markets, the latest semi-annual turnover reports from the world’s FX committees show that turnover recovered in October 2020, but failed to achieve the heights of October 2019, when they set a new high-water mark.
Taken together, the seven centres to report data – Hong Kong is back after a brief hiatus – handled $5.334 trillion per day in October 2020, up 8.2% from April 2020, but down 4.3% year-on-year. Compared to April 2019, the last global survey of turnover by the Bank for International Settlements, the latest survey indicates a slowdown and a “BIS number” of $6.38 trillion per day, compared to the official $6.6 trillion marker set in 2019.
As can often be the case with these reports, there was no global trend – spot turnover declined on a year-on-year basis in the world’s biggest centre, the UK, while it rose in everywhere else except for Canada. It was a similar picture in FX swaps, with UK turnover declining, but the US, Singapore and Japan increasing. In overall terms, activity declined year-on-year in the UK, Hong Kong and Canada, while it was unchanged in Australia, and rose in the US, Singapore and Japan.
Compared to the April survey, which came after the vol shock of March, all centres saw an increase in activity except for Canada, which was slightly lower.
With turnover in the UK dropping 10.4% it was left to other centres to make up the shortfall and while the US rose 4.9%, the longer-term driver of FX turnover growth and sustainability appears to be Asia. Turnover in Japan hit a new high in October 2020, while Singapore hit its second highest peak, just below that of April 2019. Hong Kong has not been reporting data long, and the numbers are slightly skewed by an incredibly strong April 2019 report which saw the centre report more than 38% above its then average, but it remains steady near recent highs. Australia also published a strong report, with turnover at its highest level since October 2014.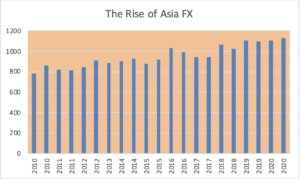
The UK reported average daily volume (ADV) of $2.582 trillion, as noted a 10.4% decline from the previous October, with volume falling in all products. Spot turnover was $706 billion, down 6.4% year-on-year, while outright forwards turnover was $391 billion, down from $443 billion in October 2019. Included in this data, NDF volume also tracked lower, to $108.9 billion from $131.6 billion the year before. FX options activity was $127 billion per day, down from $148 the year before.
In the US spot turnover was $372.7 billion per day, the highest since October 2018 and up 4% year-on-year. Conversely outright forward turnover was $184 billion, including $45.8 billion in NDFs daily, a fall of 4.6% in outrights and a decline of 8% in NDFs. FX options suffered even more, recording $46 billion per day in the latest survey, down 24.2% from the previous year.
The real strength in the US report from the FXC was FX swaps, which recorded its highest level to date at $330.7 billion per day, an impressive 19.2% increase on October 2019 and 9.3% above the previous high, set in October 2017.
Asian centres provided strong reports, Hong Kong reporting ADV of $564.6, actually a tiny decline year-on-year and within the product set there was some divergence. Spot turnover rose 25.3% year-on-year to $99.4 billion, while outright forwards declined by 15.5% to $51.7 billon. Hong Kong remains a heavily swap-dominated centre in FX terms, with the product recording ADV of $362.1 billion, again though, this is a decline, albeit of just 6%, year-on-year. FX options turnover was $16.5 billion, a 6.5% increase.
Turnover in Singapore was $564.4 billion in October 2020, a 3% increase year-on-year and, as noted earlier, the second highest reported by the centre. Only outright forwards (the UK and US are the only centres to break out NDF data) saw activity decline, to $67.8 billion from $71.2 billion.
Spot turnover was strong in Singapore, something that, if sustained, will be heartening to the local authorities as they continue their push to have more e-FX engines stationed in the city state. Activity was $122.1 billion in spot, slightly below the highest to date, set in the April report. This represents a massive 43.9% increase year-on-year and is comfortably higher than Singapore’s long term average in the high $90 billions.
FX swaps remain the biggest product in Singapore, ADV was $284 billion, up 7.9 year-on-year and the highest yet recorded by the centre – the previous peak being $275.5 billion in April 2019. FX options turnover was $32.6 billion, up 17.8% from October 2019.
The Tokyo FX Committee report signals October 2020 was the busiest in Japan since it started reporting results in 2006 with ADV across products hitting $425.7 billion, nudging higher than the previous high of $424.3 billion in the April report and 4.2% higher year-on-year.
As was the case elsewhere, there were diverging fortunes for different products with the cash side of the FX business driving growth. Spot activity in Japan was the highest since April 2013 at $138.2 billion, up 8.8% year-on-year; while FX swaps turnover was $223.3 billion, fractionally below April 2020’s peak and a 10.5% increase year-on-year.
Conversely, outright forwards activity in Japan was $51.5 billion, down 6.7% year-on-year, while FX options ADV was $6.8 billion, down 17.1%.
Finally in Asia, the Australian FX Committee reports ADV of $139.4 billion, unchanged year-on-year and the highest since October 2014. Spot turnover in the centre was $43.3 billion, the highest since April 2013 and 10.7% up year-on-year, while the other three products saw small declines. FX swaps turnover was $78 billion (down 1.7%), outright forwards $13.9 billion (–16.3%), and FX options just under $1 billion (-10%).
Overall the reports paint a healthy picture of an industry sustaining activity levels in spite of the challenge of the pandemic. Although Canada saw activity decline both from the previous report and year-on-year, even here it needs to be noted that ADV in the centre was the third highest since it started reporting in 2006. The surge in activity in recent years in Canada was mainly in the swaps, the latest report seeing $92.9 billion per day traded (down from $96.1 billion in October 2019); while spot ADV was $13.7 billion ($20.9 billion), outright forwards $11.4 billion ($14 billion) and FX options turnover was $3.4 billion ($4.6 billion).
Looking across the reports one stand out is that activity in outright forwards activity fell everywhere. Given how most centres report NDF activity under this banner, it is reasonable to assume that this represents a drop in activity in emerging markets as the world remains, at heart, ‘risk-off’.
Looking ahead, as the pandemic’s impact eases, it is likely that activity in EM will pick up again and the surveys will reflect this. Given the challenges of dispersed working in some many centres, the reports offer hope that when things return to “normal”, activity will once again pick up. The economic impact of the pandemic is yet to play out, but the early signs for the FX market is that it is business as usual.