What Happened at the Month-End Fix?
Posted by Colin Lambert. Last updated: November 3, 2022
It was a quieter than usual London 4pm month-end fix on October 31 in terms of market impact, with significantly different outcomes, depending upon what currency pair was being traded (and if you were in the NZD, look away now).
The overall saving across a portfolio of currency pairs was $434 per million, the fourth lowest since The Full FX started publishing data 19 months ago, but still a significant saving given the amounts involved at the Fix. The 19-month average for savings across the same portfolio is just under $740 per million, using the Siren methodology rather than the WM.
Although the potential savings were lower than last month, all three Commonwealth currencies saw market impact at the end of October, with NZD/USD leading the way at $2,001 per million, by far the largest saving registered yet for this pair (by some 30%). AUD/USD also provided significant savings of $501 per million and USD/CAD of $498 per million, however both were under the 19-month average of $806 and $582 respectively.
The good news was that those investors executing against the WM reference rate had significantly lower market impact that usual in the major pairs, with both EUR/USD and USD/JPY providing the second lowest potential over the past 19 months.
To provide context, the table also presents projected dollars per million savings across a portfolio of different pairs using a correlation with the Fix calculation, depending upon how much flow was in the direction of the market, or “with the wind”.
| October 31 |
| CCY Pair | WMR 4pm Fix* | Siren Fix | 100%** | 80% | 70% | 60% |
| EUR/USD | 0.98835 | 0.98824 | $111 | $67 | $45 | $22 |
| USD/JPY | 148.635 | 148.671 | $242 | $145 | $97 | $48 |
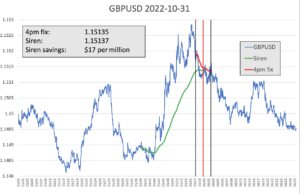
| GBP/USD | 1.15135 | 1.15137 | $17 | $10 | $7 | $3 |
| AUD/USD | 0.63945 | 0.63913 | $501 | $300 | $200 | $100 |
| USD/CAD | 1.36405 | 1.36471 | $498 | $299 | $199 | $100 |
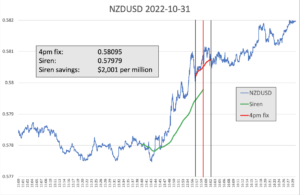
| NZD/USD | 0.58095 | 0.57979 | $2001 | $1200 | $800 | $400 |
| USD/CHF | 1.00075 | 1.00079 | $40 | $24 | $16 | $8 |
| USD/NOK | 10.39685 | 10.40108 | $407 | $244 | $163 | $81 |
| USD/SEK | 11.05045 | 11.04946 | $90 | $54 | $36 | $18 |
| Average | $434 | $260 | $174 | $87 |
*According to Raidne calculation using NewChange FX data
** Savings are in dollars per million by percentage of correlation to the Fix flow. Blue cells signify a projected saving using Siren, Red cells a saving using WMR
The charts below offer an insight into two very different outcomes, with Cable and NZD both trending higher ahead of the fix, the normal pre-hedging period for executing agents on WM, but then having completely different outcomes. Cable, in line with what has been a very volatile few weeks for the pair after it hit a new all-time low and then bounced around as governments came and went, saw a sharp reversal at the start of the window, suggesting that what flow there was (anecdotally, sources say some users hedged in the days leading up to the month-end to avoid a potential blow out) had not been pre-hedged. There was reasonable steady selling, pushing the pair down around 10 points only during the five-minute WM window.

Source: Raidne
In NZD by contrast, while there was a reversal in the minute ahead of the shorter window, clearly there was interest to buy NZD throughout, as the uptrend resumed. In many ways, the Kiwi exhibited what could be seen as typical characteristics of a WM Fix, it moved ahead of the window, continued that move in the early minutes, and then saw a reversal at the very end.
Certainly the $2,000 per million market impact cost would not have been welcomed by investors who had, presumably, already been waiting for over 12 hours to execute their hedges.

Source: Raidne
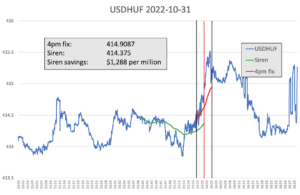
Every month The Full FX is selecting an emerging market currency pair at random, and before the data is available, to broaden the analysis – this month the selected pair is USD/HUF. Data is again provided by Raidne according to the same guidelines in place for the regularly reported currency pairs.
As was the case with the NZD, there was steady buying of USD/HUF into the WM window, which continued throughout, before the usual reversal in the last few seconds. Interestingly, some minutes after the window closed, USD/HUF reverted back to levels seen before the windows opened, suggesting that, once again, the level of flow in the five minute window exhausted available liquidity.

Source: Raidne


