What Happened at the Month-End Fix?
Posted by Colin Lambert. Last updated: May 4, 2022
With Refinitiv Benchmarks completing its consultation over the future of the WM Fix, and Raidne releasing a new service that allows users of the three regulated benchmark fixes to assess their execution quality, the latest evidence of potential savings available from a longer window are, perhaps, well-timed, coming in, as they do, largely in line with the previous 12 months’ data.
Depending upon the currency pair being hedged there was a vast difference in the potential impact of the flow, with Cable ($64) and USD/CAD ($102) continuing their ‘feast or famine’ trend by registering low savings, but two of the four ‘majors’ providing savings in excess of $1,000 per million in the longer window.
AUD/USD registered the highest savings at $1,491 per million, the second highest since The Full FX started tracking the two fixes, using data delivered by Raidne, which owns the Siren Fix. The Full FX has independently verified that the WMR data, which is calculated from New Change FX data by Raidne, reasonably reflects the month-end rates delivered by WMR.
USD/JPY at $1,164 per million would have given those seeking best execution a headache, this is the highest saving yet in this pair, which is, of course, the second most traded in the world. USD/CHF savings were $1,124 per million, while EUR/USD had a below average impact of $531 (compared to an average of $794.50 over the 13 months the data has been published by The Full FX.)
To provide more context, the table also presents projected dollars per million savings across a portfolio of different pairs using a correlation with the Fix calculation, depending upon how much flow was in the direction of the market, or “with the wind”.
| April 29 |
| CCY Pair | WMR 4pm Fix* | Siren Fix | 100%** | 80% | 70% | 60% |
| EUR/USD | 1.05495 | 1.05439 | $531 | $319 | $212 | $106 |
| USD/JPY | 129.56 | 129.711 | $1,164 | $698 | $466 | $233 |
| GBP/USD | 1.2555 | 1.25558 | $64 | $38 | $25 | $13 |
| AUD/USD | 0.71065 | 0.71166 | $1,419 | $852 | $568 | $284 |
| USD/CAD | 1.27805 | 1.27818 | $102 | $61 | $41 | $20 |
| NZD/USD | 0.64905 | 0.64952 | $724 | $434 | $289 | $145 |
| USD/CHF | 0.97065 | 0.96956 | $1,124 | $675 | $450 | $225 |
| USD/NOK | 9.3165 | 9.30791 | $923 | $554 | $369 | $185 |
| USD/SEK | 9.7924 | 9.80146 | $924 | $555 | $370 | $185 |
| Average | $775 | $465 | $310 | $155 |
*According to Raidne calculation using NewChange FX data
** Savings are in dollars per million by percentage of correlation to the Fix flow. Blue cells signify a projected saving using Siren, Red cells a saving using WMR
Interestingly with the AUD/USD fix, although the potential savings were very large, the chart below suggests that it was sheer weight of flow that pushed the market lower, reinforced by a lack of bounce after the window closes – a characteristic of other crosses where speculators have been heavy players by keying on early window trading.
The pair swung around during the five-minute window, but the market is really characterised by what looks like steady (pre) hedging of the Fix, with the market drifting some 25 points lower into the WMR window.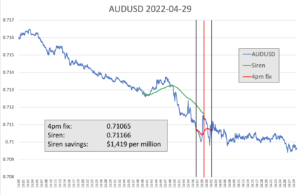
Every month The Full FX is selecting an emerging market currency pair at random, and before the data is available, to broaden the analysis – this month the selected pair is USD/MXN. Data is again provided by Raidne according to the same guidelines in place for the regularly reported currency pairs.
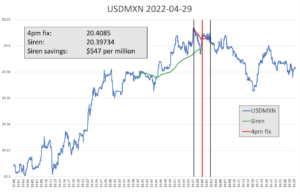
Unlike with the AUD, UDSD/MXN did see a reversion towards the end of the fixing window, although again, overall, there was definitely a bias to buy US dollar. Again, however, there was a degree of two-way volatility during the five-minute window, although the market exited that period at, or very close to, the high of the hour. The savings of $547 per million are sizeable but probably just below trend over the 13 months of this analysis