
What Happened at the Month-End Fix?
Posted by Colin Lambert. Last updated: August 11, 2025
It was another subdued month-end Fix in terms of market impact in July, albeit one still offering potential savings of $229 per million for investors across the usual portfolio of nine currency pairs.
All pairs offered potential savings from using the longer Siren FX 20-minute window compared to the five-minute WMR window, but they were all lower than the 52-month average since The Full FX started publishing data. Good news for investors, given the sheer size of the market, is that the lowest potential savings, $26 per million (and what professional execution desk wouldn’t fight hard for that saving elsewhere?) were in EUR/USD, however this was balanced by larger market impact in USD/JPY ($213 per million) and Cable ($325 per million).
Part of the reason for the lower impact may have been a more confusing picture for speculators, for while the general consensus amongst market analysts was that there would be mild dollar selling into the month-end, the reality was the dollar was in demand around the Fix. This means specs could have been receiving mixed signals as this expectation merged with the TWAP algos pre-hedging on the other side. If this is the case, it is likely the second successive month-end this has happened, both June and July were well below the historical average for execution costs.
To provide more context, the table below also presents projected dollars per million savings across a portfolio of different pairs using a correlation with the Fix calculation, depending upon how much flow was in the direction of the market, or “with the wind”. The rates used for the WM column are calculated using Siren’s proxy five-minute window, which utilises data from New Change FX, however The Full FX endeavours to check that they are a reasonable reflection of those published by the WM.
| July 31 |
| CCY Pair | WMR 4pm Fix* | Siren Fix | 100%** | 80% | 70% | 60% |
| EUR/USD | 1.14451 | 1.14454 | $26 | $16 | $10 | $5 |
| USD/JPY | 150.499 | 150.467 | $213 | $128 | $85 | $43 |
| GBP/USD | 1.32334 | 1.32291 | $325 | $195 | $130 | $65 |
| AUD/USD | 0.64382 | 0.64380 | $31 | $19 | $12 | $6 |
| USD/CAD | 1.38259 | 1.38298 | $282 | $169 | $113 | $56 |
| NZD/USD | 0.59024 | 0.59009 | $254 | $153 | $102 | $51 |
| USD/CHF | 0.81207 | 0.81202 | $62 | $37 | $25 | $12 |
| USD/NOK | 10.29345 | 10.28842 | $489 | $293 | $196 | $98 |
| USD/SEK | 9.76052 | 9.76425 | $382 | $229 | $153 | $76 |
| Average | $229 | $138 | $92 | $46 |
*According to Siren FX calculation using New Change FX data
** Savings are in dollars per million by percentage of correlation to the Fix flow. Blue cells signify a projected saving using Siren, Red cells a saving using WMR
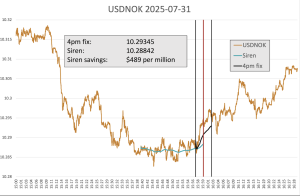
The highest potential saving from the longer window came in USD/NOK at $489 per million, however it is hard to know whether this was merely the fact that the Siren fixing largely takes place before the window and that there was no pre-hedging required.
Source: Siren FX
Either way the market was steady during what would normally be the period within which dealers start to hedge their fixing exposures, before rising steadily in the WM window itself. Also of note, the lack of a reversal in the WM window suggests minimal speculative activity at the July month-end in this pair, which is probably to be expected as there are more liquid pairs that behave more predictably.
Notwithstanding that, USD/NOK seems to have reflected the broader picture in that dollars were in demand, but perhaps not in the size that is normally associated with a month-end.
Every month, The Full FX is selecting an emerging market currency pair at random, and before the data is available, to broaden the analysis – this month the selected pair is USD/ZAR. Data is again provided by Siren FX according to the same guidelines in place for the regularly reported currency pairs.
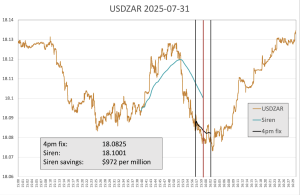
USD/ZAR exhibited more traditional characteristics of a month-end Fix – and was also subject to the expected dollar selling – with a prolonged period of selling leading into the window, followed by a reversal towards the end of the WM window (followed by more selling).
Source: Siren FX
The suspicion is that speculative accounts were in play here, with USD/ZAR dropping around four big figures into the five-minute calculation window, but that the genuine fixing flow had a sizeable impact. This can be seen in the reversal in the market post-WM window, indeed USD/ZAR gave up a five big figure loss and then some in just 20 minutes after the WM window closed.
The potential saving in USD/ZAR, at $972 per million, is slightly below the 51-month average of $1,045 per million, but it still only the fifth largest impact in the past 12 months.