What Happened at the Month-End Fix?
Posted by Colin Lambert. Last updated: May 7, 2025
Execution costs from using a shorter fixing window rose at the end of what was a busy month in FX markets, with the potential savings from using the 20-minute Siren FX methodology, compared to the five-minute WM, hitting their highest level since December 2023 across a portfolio of nine currency pairs.
The portfolio saving was $842 per million, more than double the 2024 average and almost 50% over the 49-month average since The Full FX started tracking the data. All of the nine currency pairs were above their long-term and 2024 averages, with the exception of USD/CAD, which was close to the latter.
Perhaps most concerning for investors whose funds are being hedged, the three busiest currency pairs, EUR/USD, USD/JPY and Cable, all offered significant savings, albeit less that AUD, NOK and SEK, all of whom saw potential savings in excess of $1,000 per million using the longer window. The execution cost in EUR/USD was the highest since December 2023, while that in USD/JPY surpassed that from May 2024 and Cable that from November 2023. The hit in AUD/USD was the highest since September 2022.
According to data provided to The Full FX for checking purposes, in the cases of AUD, CHF, GBP and JPY, the actual WM Fix would have provided slightly higher potential savings, while in the others, the saving is slightly lower.
The uncertainty in markets – there was even a division amongst analysts over exactly what the month-end flows were expected to be – seems to have driven dealers to ensure they hedged ahead of the WM Fix, with all pairs seeing activity before that window opened, notably, in USD/SEK, selling started some five-seven minutes out, pushing the pair down four big figures, before it recovered out the window, to trade at the pre-Fix levels just 20 minutes after.
To provide more context, the table below also presents projected dollars per million savings across a portfolio of different pairs using a correlation with the Fix calculation, depending upon how much flow was in the direction of the market, or “with the wind”. As noted, the rates used for the WM column are calculated using a higher frequency data set from New Change FX, however The Full FX endeavours to check that they are a reasonable reflection of those published by the LSEG-owned business.
| April 30 |
| CCY Pair | WMR 4pm Fix* | Siren Fix | 100%** | 80% | 70% | 60% |
| EUR/USD | 1.13679 | 1.13613 | $581 | $349 | $232 | $116 |
| USD/JPY | 142.644 | 142.775 | $918 | $551 | $367 | $184 |
| GBP/USD | 1.33563 | 1.33454 | $817 | $490 | $327 | $163 |
| AUD/USD | 0.63981 | 0.63908 | $1,142 | $685 | $457 | $228 |
| USD/CAD | 1.3812 | 1.38157 | $268 | $161 | $107 | $54 |
| NZD/USD | 0.5935 | 0.59323 | $455 | $273 | $182 | $91 |
| USD/CHF | 0.82181 | 0.82254 | $887 | $532 | $355 | $177 |
| USD/NOK | 10.36958 | 10.38094 | $1,094 | $657 | $438 | $219 |
| USD/SEK | 9.64474 | 9.65842 | $1,416 | $850 | $567 | $283 |
| Average | $842 | $505 | $337 | $168 |
*According to Siren FX calculation using NewChange FX data
** Savings are in dollars per million by percentage of correlation to the Fix flow. Blue cells signify a projected saving using Siren, Red cells a saving using WMR
Cable, which had been trading relatively steady leading up to the fixing window, saw a sharp spike higher around five-six minutes out, pushing the pair some 20 pips higher. This would have likely been partly pre-hedging, or hedging ahead of the Fix as it is meant to be termed, but the speed of the move probably means speculators picked up on the algo interest and jumped into the market.

Source: Siren FX
There was more sideways trading into the WM window opening, before another 15-pip push higher, from when the pair traded sideways to the end. For those looking for evidence of the market impact of fixing flows around the five-minute window, the chart below is a classic example, with the pair settling back some 20 minutes later to where it had spent a great part of the afternoon.
Of those pairs to offer large savings, only AUD/USD seems not to have reverted post-WM window, the pair climbed steadily into the 4pm Fix, but traded steadily afterwards.
Every month, The Full FX is selecting an emerging market currency pair at random, and before the data is available, to broaden the analysis – this month the selected pair is USD/ZAR. Data is again provided by Siren FX according to the same guidelines in place for the regularly reported currency pairs.
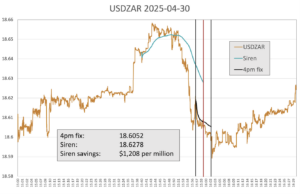
Source: Siren FX
Price action in USD/ZAR offered the highest savings for an emerging market pair since August 2024 at $1,208 per million, although there was evidence of speculative activity. The pair actually saw a 200-point jump just before the Siren FX window opened, this was followed by some more sustained buying before, some seven minutes before the WM window opened, USD selling kicked in. A local dealer tells The Full FX that speculators may have been caught out by the price action, thinking that dollar buying was likely, and that this led to a sharp down move into the WM window as the pair dropped some 500 pips.
There was another jump into the five-minute window, before sustained selling set in again. Interestingly, there was another spike lower at the close of the WM window, something the local dealer puts down to stop losses from remaining longs hoping for a move higher from fixing flows.
As was the case with many other pairs this month, USD/ZAR recovered steadily, post-WM window, the trade relatively unchanged over the hour. Overall, the potential savings were just above the 49-month average of $1,057 per million, and significantly over the 2024 average of $774 per million.