What Happened at the Month-End Fix?
Posted by Colin Lambert. Last updated: April 9, 2025
Market impact costs rose for the March month-end benchmark fix compared to recent results, although it was very much a mixed bag amongst the nine currency pairs tracked.
The overall saving across those pairs from using the Siren FX 20-minute versus the five-minute WMR methodology was $434 per million, matching the savings in May 2024, and the highest since February of that year. Perhaps more concerning is how the world’s second busiest currency pair, USD/JPY, exhibited the highest potential savings at almost $850 per million – given the amounts that go through the pair, this could have been a very costly month-end for investors.
While the JPY savings were the highest since May 2024, EUR/USD, at $435 per million, was very much in line with both its recent numbers, and its four-year average since The Full FX started tracking results. Both were considerably above the 2024 average, EUR/USD by more than double, which was the case for all pairs with the exception of Cable, USD/CHF and USD/SEK, the latter two of which had historically low potential savings at $57 per million and $61 per million respectively.
Although low impact costs in what was still a volatile market may be a surprise, sources at executing banks say that flows through CHF and SEK were lower than usual, the second month in a row that has been the case for the former. This, the sources suggest, means that hedging ahead of the Fix – activity that the Siren benchmark methodology largely picks up, was minimal, if it occurred at all.
Checking with market sources, one aspect of recent fixes that has triggered comment – the difference between the WM Fix and the New Change FX-Calculated five-minute proxy – was not a factor at this month-end, something that might be of interest to anyone caught up in the disruption caused by the late publishing of WM 4pm rates on 3 April.
To provide more context, the table below also presents projected dollars per million savings across a portfolio of different pairs using a correlation with the Fix calculation, depending upon how much flow was in the direction of the market, or “with the wind”. As noted, the rates used for the WM column are calculated using a higher frequency data set from New Change FX, however The Full FX endeavours to check that they are a reasonable reflection of those published by the LSEG-owned business.
| March 31 |
| CCY Pair | WMR 4pm Fix* | Siren Fix | 100%** | 80% | 70% | 60% |
| EUR/USD | 1.08018 | 1.07971 | $435 | $261 | $174 | $87 |
| USD/JPY | 149.533 | 149.662 | $862 | $517 | $345 | $172 |
| GBP/USD | 1.29078 | 1.29109 | $240 | $144 | $96 | $48 |
| AUD/USD | 0.62307 | 0.62273 | $546 | $328 | $218 | $109 |
| USD/CAD | 1.43917 | 1.4387 | $327 | $196 | $131 | $65 |
| NZD/USD | 0.5664 | 0.56592 | $848 | $509 | $339 | $170 |
| USD/CHF | 0.88467 | 0.88472 | $57 | $34 | $23 | $11 |
| USD/NOK | 10.53418 | 10.53977 | $530 | $318 | $212 | $106 |
| USD/SEK | 10.04402 | 10.04463 | $61 | $36 | $24 | $12 |
| Average | $434 | $260 | $174 | $87 |
*According to Siren FX calculation using NewChange FX data
** Savings are in dollars per million by percentage of correlation to the Fix flow. Blue cells signify a projected saving using Siren, Red cells a saving using WMR
USD/JPY witnessed a classic pre-hedging, or hedging ahead of the Fix as it is meant to be termed, move, with the pair dropping almost 30 points in the 10 minutes before the WM window opened. Unlike previous months, the pre-WM hedging didn’t start 15 or 20 minutes before and this could have contributed to the sharp drop as the flow overwhelmed liquidity.
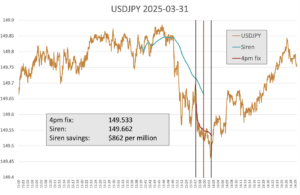
Source: Siren FX
As is usually associated with these events, however, there does appear to have been decent speculative activity involved, but unusually the pair continued lower to the end of the WM window, rather than see a late bounce as specs took profit. That said, USD/JPY exited the WM window at the low for the hour (around 149.47), and then rose steadily in the 20-25 minutes afterwards, peaking at 149.83, which is pretty much where the pair traded for much of the previous 30 minutes into the window.
Every month, The Full FX is selecting an emerging market currency pair at random, and before the data is available, to broaden the analysis – this month the selected pair is USD/MXN. Data is again provided by Siren FX according to the same guidelines in place for the regularly reported currency pairs.
Perhaps highlighting the chaotic nature of markets, USD/MXN saw a similar move to USD/JPY, just in the opposite direction! Hedging ahead of WM only took place for about three or four minutes, prompting a move from below 20.42 to 20.435, there was then a spike to 20.48 as initial USD buying fed in, before a retracement, followed by a sideways end to the window. Unlike in USD/JPY, the pair also traded sideways in the immediate aftermath of the WM Fix, suggesting a lack of speculative activity, unless of course, it exited during the window itself
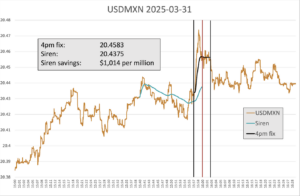
Source: Siren FX
At $1,014 per million, the potential savings from the Siren methodology were massive, the highest in the selected emerging market pair since August 2024, which was also in USD/MXN. Over a 47-month period, the savings were fractionally underneath the average of $1,050 per million, but were significantly higher than the 2024 average of almost $775 per million.