What Happened at the Month End Fix?
Posted by Colin Lambert. Last updated: October 4, 2021
In terms of savings from a longer fixing window, the sixth analysis of FX month-end Fix flows, provided by Raidne and published by The Full FX, is the lowest to date, albeit still with a significant $362 per million saving across a portfolio of currencies.
Once again, the market appeared to call month-end flows wrong, suggesting either that the analysis was flawed or significant exposures were hedged ahead of time, or away from the window itself.
The data tables below offer a comparison with data delivered by Raidne, which owns the Siren Fix. The Full FX has independently verified that the WMR data, which is calculated from New Change FX data by Raidne, reasonably reflects the month-end rates delivered by WMR. In terms of unadjusted outliers, the WMR WM USD/NOK Fix was 6.72925, meaning a slightly higher saving using Siren.
| September 30 |
| CCY Pair | WMR 4pm Fix* | Siren Fix | 100%** | 80% | 70% | 60% |
| EUR/USD | 1.15893 | 1.15902 | $78 | $47 | $31 | $16 |
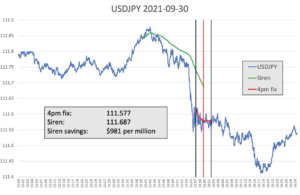
| USD/JPY | 111.577 | 111.687 | $985 | $591 | $394 | $197 |
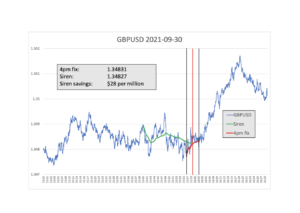
| GBP/USD | 1.34831 | 1.34827 | $28 | $18 | $12 | $6 |
| AUD/USD | 0.72235 | 0.72281 | $636 | $382 | $255 | $127 |
| USD/CAD | 1.26685 | 1.26682 | $25 | $15 | $10 | $5 |
| NZD/USD | 0.68988 | 0.69013 | $362 | $217 | $145 | $72 |
| USD/CHF | 0.93282 | 0.93319 | $396 | $238 | $159 | $79 |
| USD/NOK | 8.73096 | 8.73601 | $578 | $347 | $231 | $116 |
| USD/SEK | 8.74824 | 8.74968 | $165 | $99 | $66 | $33 |
| Average | $362 | $217 | $145 | $72 |
*According to Raidne calculation using NewChange FX data
** Savings are in dollars per million by percentage of correlation to the Fix flow. Blue cells signify a projected saving using Siren, Red cells a saving using WMR
To provide more context, the table also presents projected dollars per million savings across a portfolio of different pairs using a correlation with the Fix calculation, depending upon how much flow was in the direction of the market, or “with the wind”.
The eye-catching number of clearly USD/JPY and as one of the heaviest traded currency pairs, a potential saving of $985 per million is hugely significant. It should be noted, however, that is not an outlier, of the six month ends analysed, just one – June – has provided savings under $500 per million (the peak so far being $1,005 per million in May.
For once the perennial problem children of Cable and USD/CAD, had quiet fixes, the former providing the smallest saving of the portfolio at $28 (regular chart provided below), indeed Cable saw an upmove after the window had closed, which could have been position squaring by speculators. USD/CAD, perhaps reinforcing its capriciousness, became only the second pair in the six months’ of analysis to show a small saving by using WM.
Elsewhere, there were hefty savings in AUD/USD at $636 per million, the third highest saving for this pair in the six month, as well as in USD/NOK (although this was below the normal savings seen thus far).
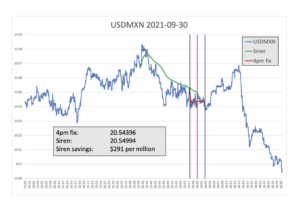
Every month The Full FX is selecting an emerging market currency pair at random to broaden the analysis – this month the selected pair is USD/MXN.
Again data is provided by Raidne according to the same guidelines in place for the regularly reported currency pairs. Although the impact was less sizeable than some seen to date in this analysis, the price action in the chart above does suggest selling ahead of the window, with a reversion post-Fix.

