What Happened at the Month-End Fix?
Posted by Colin Lambert. Last updated: February 5, 2024
Market impact at the month-end FX fix was significantly lower than the average, indeed the potential savings from using the longer Siren FX window over the WM window were the fourth lowest since The Full FX started publishing results.
Across the portfolio of nine currency pairs there was still a $370 per million saving for those trading with the direction of the market, thus it was still significant, however it is below the 34-month average of just over $673 per million.
A big driver of the lower costs was AUD/USD at just $15 per million – still more than the average algo provider will charge to execute – which is the second lowest monthly saving at 100% recorded in the almost-three years, only behand Cable and its $8 per million saving in September 2023.
Only two pairs, USD/JPY and USD/SEK were above their long-term average, the latter only just, coincidentally, these two pairs also had the highest execution cost or market impact in the December 2023 month-end Fix.
To provide more context, the table below also presents projected dollars per million savings across a portfolio of different pairs using a correlation with the Fix calculation, depending upon how much flow was in the direction of the market, or “with the wind”. The Full FX has verified that the WM rates used here are a reasonable reflection of that fixing.
| January 31 |
| CCY Pair | WMR 4pm Fix* | Siren Fix | 100%** | 80% | 70% | 60% |
| EUR/USD | 1.0863 | 1.08598 | $295 | $177 | $118 | $59 |
| USD/JPY | 146.175 | 146.306 | $895 | $537 | $358 | $179 |
| GBP/USD | 1.2734 | 1.27317 | $181 | $108 | $72 | $36 |
| AUD/USD | 0.66105 | 0.66104 | $15 | $9 | $6 | $3 |
| USD/CAD | 1.33604 | 1.3363 | $195 | $117 | $78 | $39 |
| NZD/USD | 0.6155 | 0.61557 | $114 | $68 | $45 | $23 |
| USD/CHF | 0.8579 | 0.85759 | $361 | $217 | $145 | $72 |
| USD/NOK | 10.4565 | 10.45233 | $399 | $239 | $160 | $80 |
| USD/SEK | 10.3324 | 10.34148 | $878 | $527 | $351 | $176 |
| Average | $371 | $222 | $148 | $74 |
*According to Siren FX calculation using NewChange FX data
** Savings are in dollars per million by percentage of correlation to the Fix flow. Blue cells signify a projected saving using Siren, Red cells a saving using WMR
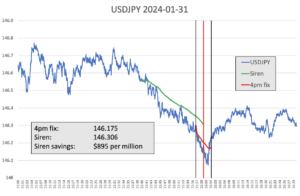
In USD/JPY the price action suggests a classic (pre)hedging move, with the market selling steadily lower in the 20 minutes ahead of the five-minute WM window – flow that is captured by the Siren fix. The market entered the WM window some 35 points lower than it was 20 minutes previously, with the downward pressure continuing through the first three-quarters of the window, before we saw what is the customary bounce over the last minute or so.

Source: Siren FX
Post-fix, the market traded slightly higher again, by some 20 points, suggesting speculators were taking profits and other players were talking advantage of the end of the flow hitting the market.
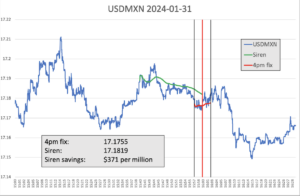
Every month, The Full FX is selecting an emerging market currency pair at random, and before the data is available, to broaden the analysis – this month the selected pair is USD/MXN. Data is again provided by Siren FX according to the same guidelines in place for the regularly reported currency pairs.
The savings for January indicate that it was also a quiet month-end for emerging markets, with a saving of just $371 per million, this compares to the longer-term average above $1,100 per million. Although savings were the lowest since June 2022, they are actually only the fifth lowest in the 33 months The Full FX has been tracking emerging markets pairs.

Source: Siren FX
The price action suggests that there was not much in the way of flow at the month-end, although again there was steady dollar selling. In the window itself, price action was very two-way – again suggesting that there was little in the way of interest. The selling did continue after the windows closed.

