What Happened at the Month-End Fix?
Posted by Colin Lambert. Last updated: April 11, 2023
It was another quieter than average month-end fix in terms of potential savings from a longer window, however the overall savings available through a longer window were the highest thus far in 2023.
The March month-end fix also marked the end of the second year for The Full FX publishing this data, and this month’s overall saving of $529 per million from the longer window compares to the 24-month average of $709.58 per million.
While USD/SEK saw the largest savings using the 20-minute Siren Fix, compared to the five-minute WM Fix at $1,119 per million, there was also substantial market impact from (pre) hedging flows in AUD and NZD, both of which registered savings in excess of $700 per million, meaning not only did investors in funds using London 4pm have a long interval before hedging their portfolios, the market impact potentially cost them extra dollars.
To provide context, the table below also presents projected dollars per million savings across the portfolio of currency pairs using a correlation with the Fix calculation, depending upon how much flow was in the direction of the market, or “with the wind”.
Please note, Raidne, the publisher of the Siren Fix and provider of this data, has re-branded to Siren FX.
| March 31 |
| CCY Pair | WMR 4pm Fix* | Siren Fix | 100%** | 80% | 70% | 60% |
| EUR/USD | 1.0865 | 1.0869 | $423 | $254 | $169 | $85 |
| USD/JPY | 133.09 | 133.121 | $233 | $140 | $93 | $47 |
| GBP/USD | 1.2365 | 1.2359 | $469 | $282 | $188 | $94 |
| AUD/USD | 0.6698 | 0.6693 | $732 | $439 | $293 | $146 |
| USD/CAD | 1.3534 | 1.3536 | $155 | $93 | $62 | $31 |
| NZD/USD | 0.6257 | 0.6252 | $736 | $441 | $294 | $147 |
| USD/CHF | 0.9136 | 0.9133 | $307 | $184 | $123 | $61 |
| USD/NOK | 10.4731 | 10.4669 | $591 | $355 | $237 | $118 |
| USD/SEK | 10.3696 | 10.3580 | $1,119 | $671 | $448 | $224 |
| Average | $529 | $318 | $212 | $106 |
*According to Siren FX calculation using NewChange FX data
** Savings are in dollars per million by percentage of correlation to the Fix flow. Blue cells signify a projected saving using Siren, Red cells a saving using WMR
In the majors, Cable and EUR/USD saw the most market impact, although as the chart shows, the potential savings were trimmed in EUR/USD by a reversal during the five-minute calculation window. The good news for investors is that the relatively steady, two-way, market in EUR/USD during the five-minute window suggests that the (pre) hedging effectively took out potential volatility during the Fix; the bad news is that much of the effective hedging was not included in the calculation for the Fix itself – hence the $423 per million cost.
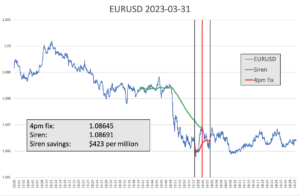
Source: Siren FX
Every month The Full FX is selecting an emerging market currency pair at random, and before the data is available, to broaden the analysis – this month the selected pair is USD/MXN. Data is again provided by Siren FX according to the same guidelines in place for the regularly reported currency pairs.
Although the potential savings were lower than the longer-term average, the price action in USD/MXN is pretty ugly for any investor buying dollars, with the (pre) hedging starting some five-six minutes before the WM window opened, prompting a steady dollar rise from below 18.01 to just below 18.07. During the window itself, after an initial climb, the pair fell back, in a whippy fashion, to end the window below where it entered. Whippy price action continued after the five-minute window closed, with USD/MXN falling slightly further, post-Fix.
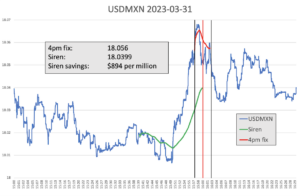
Source: Siren FX
In dollar terms, the potential saving using the longer Siren window was $894 per million, this is below the $1.146.61 23-month average (The Full FX started tracking an EM currency one month later in 2021).