What Happened at the Month-End Fix?
Posted by Colin Lambert. Last updated: May 3, 2023
Market impact from hedging ahead of the monthly WM Fix was higher than recent months, with the potential savings from a longer window hitting their highest level thus far in 2023. Worst still for users of the shorter WM window, the bigger dollar-per-million savings on the Siren Fix were largely to be had in the major currency pairs, which attract the highest volume.
The overall saving of $720 per million across the portfolio of currencies was dampened a little by lower potential savings in NZD/USD ($308 per million) and USD/NOK ($353 per million), neither were close to their low water marks, however. EUR/USD was close to the average with $725 per million, while USD/JPY saw even bigger savings from using the 20-minute Siren window at $844 per million.
As is often the case, USD/SEK offered a high potential saving of $951 per million, while AUD/USD was also higher than recent months at $848 per million. In all, only NZD, NOK and USD/CHF ($573 per million) offered lower savings that the 25-month average since The Full FX started publishing this data.
Please note, Raidne, the publisher of the Siren Fix and provider of this data, has re-branded to Siren FX.
| April 28 |
| CCY Pair | WMR 4pm Fix* | Siren Fix | 100%** | 80% | 70% | 60% |
| EUR/USD | 1.1040 | 1.1032 | $725 | $435 | $290 | $145 |
| USD/JPY | 136.165 | 136.28 | $844 | $506 | $338 | $169 |
| GBP/USD | 1.2569 | 1.2554 | $1,227 | $736 | $491 | $245 |
| AUD/USD | 0.6609 | 0.6603 | $848 | $509 | $339 | $170 |
| USD/CAD | 1.3563 | 1.3572 | $656 | $393 | $262 | $131 |
| NZD/USD | 0.6177 | 0.6175 | $308 | $185 | $123 | $62 |
| USD/CHF | 0.8901 | 0.8906 | $573 | $344 | $229 | $115 |
| USD/NOK | 10.6911 | 10.6873 | $353 | $212 | $141 | $71 |
| USD/SEK | 10.2573 | 10.2670 | $951 | $570 | $380 | $190 |
| Average | $720 | $432 | $288 | $144 |
*According to Siren FX calculation using NewChange FX data
** Savings are in dollars per million by percentage of correlation to the Fix flow. Blue cells signify a projected saving using Siren, Red cells a saving using WMR
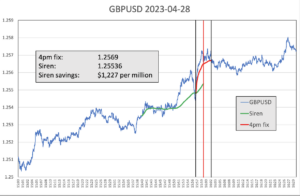
The headline act this month in terms of potential savings was Cable at a massive $1,227 per million- the fourth highest saving registered by the pair since April 2021 and the highest since July 2022’s $1,885.
Steady buying of sterling was witnessed in the lead up to the five-minute window, which saw the pair rise some 35 points before a sharp reversal in the minute leading up the opening of the shorter measurement window. Cable then resumed its uptrend through the five-minute calculation as more buyers emerged.

Source: Siren FX
Were it not for the 15-point reversal going into the WM Fix the potential savings could have been even higher as clearly there was sterling demand, the pair remaining at elevated levels in the minutes after the WM window closed.
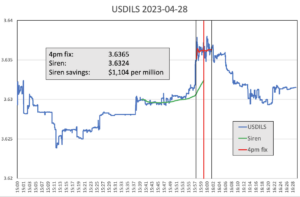
Every month The Full FX is selecting an emerging market currency pair at random, and before the data is available, to broaden the analysis – this month the selected pair is USD/ILS. Data is again provided by Siren FX according to the same guidelines in place for the regularly reported currency pairs.
Overall, the potential savings from the longer window were in line with the 24-month average of $1,144 per million, with USD/ILS providing a saving of $1,104 per million. The Fix was characterised by a sharp move higher in the seconds leading into the WM window as pre-hedging started.

Source: Siren FX
In many ways USD/ILS this month provides an insight into the issue of hedging ahead of the WM calculation window, for while it didn’t take place over an extended period of time, the impact of the trades leading into the WM Fix saw the pair rise some 30 points ahead of the open. In the window itself, however, there was lots of two-way price action in a 25-point range, which saw the pair exit the window close to where it entered. Thus, almost all the market impact of the fixing flow took place ahead of time, rather than during the calculation window itself.

