What Happened at the Month-End Fix?
Posted by Colin Lambert. Last updated: January 9, 2023
Potential savings from a longer London 4pm fixing window were pretty much in line with the long-term average at the end of December, with more than $700 per million on offer for those that calculate over a 20-minute horizon and four of the nine pairs tracked offering savings well in excess of $1,000 per million.
Given the volume traded in the pair USD/JPY was probably the headline act, providing a potential saving using the 20-minute calculation from Raidne’s Siren of $1,022 per million. This is the third highest saving since The Full FX started publishing this data in April 2021, behind April and July 2022.
Across the nine pairs monitored, the potential saving of $723 per million is slightly below the 21-month average of $744 per million. Within this, aside from USD/JPY, there were potential savings of well over $1,000 in AUD/USD, USD/CAD and USD/NOK. It was a month of contrasts, however, for while those four pairs offering savings well above the long-term average, the other five pairs were significantly below.
To provide context, the table below also presents projected dollars per million savings across the portfolio of currency pairs using a correlation with the Fix calculation, depending upon how much flow was in the direction of the market, or “with the wind”.
| December 30 |
| CCY Pair | WMR 4pm Fix* | Siren Fix | 100%** | 80% | 70% | 60% |
| EUR/USD | 1.06725 | 1.06663 | $581 | $349 | $233 | $116 |
| USD/JPY | 131.945 | 131.08 | $1,022 | $613 | $409 | $204 |
| GBP/USD | 1.2029 | 1.20275 | $125 | $75 | $50 | $25 |
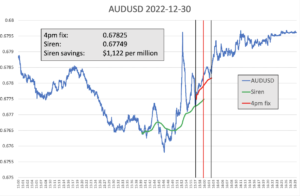
| AUD/USD | 0.67825 | 0.67749 | $1,122 | $673 | $449 | $224 |
| USD/CAD | 1.35495 | 1.35648 | $1,128 | $677 | $451 | $226 |
| NZD/USD | 0.63245 | 0.63211 | $538 | $323 | $215 | $108 |
| USD/CHF | 0.9252 | 0.92533 | $140 | $84 | $56 | $28 |
| USD/NOK | 9.8510 | 9.86529 | $1,449 | $869 | $579 | $290 |
| USD/SEK | 10.4195 | 10.42368 | $401 | $241 | $160 | $80 |
| Average | $723 | $434 | $289 | $145 |
*According to Raidne calculation using NewChange FX data
** Savings are in dollars per million by percentage of correlation to the Fix flow. Blue cells signify a projected saving using Siren, Red cells a saving using WMR
AUD/USD looks to have experienced two bouts of pre-hedging ahead of the WM 4pm Fix, although the thin nature of markets at the year would undoubtedly have exacerbated what activity there was, especially as speculative flows – which largely key upon pre-hedging activity – would have made up a bigger proportion of “normal” trading activity.
Source: Raidne
AUD/USD jumped some 10 points around 15 minutes before the WM window opened, although this was a blip in the downtrend being witnessed in the previous half-hour. Steadier buying emerged, however, around 3.46pm (London time), and this was followed by a sharp spike three minutes ahead of the five-minute window opening that saw AUD jump some 25 points, before reverting almost 100%. There was a further 10-15 point jump, which was again reversed almost completely, just ahead of the window opening and during the five-minute calculation, AUD was bought steadily, and continued to be so after the WM window closed.
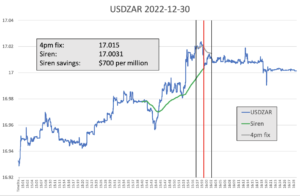
Every month The Full FX is selecting an emerging market currency pair at random, and before the data is available, to broaden the analysis – this month the selected pair is USD/ZAR. Data is again provided by Raidne according to the same guidelines in place for the regularly reported currency pairs.
Interestingly, what could have been pre-hedging activity – again there were two bouts of dollar buying leading up to the five-minute window – seems to have been wrong, because during the WM calculation window the market was sold off. There is a suggestion that speculators could have been in play again, buying dollars on what was seen as pre-hedging activity only for little or nothing to happen in the first half of the five-minute calculation.
Source: Raidne
As the window was hitting the mid-point, or perhaps in the absence of any actual month-end buying of dollars, USD/ZAR dropped almost 200 points in very short order. Again, this suggests speculators were heading for the (very small) exit at the same time. There was modest buying following that, but the overall impression is of minimal actual fixing flow through the window, with the price action generated by speculative activity.
In terms of longer-term comparisons, the $700 per million saving from using the 20-minute calculation window is below the average emerging market pair saving of $1,058 per million.