What Happened at the Month-End Fix?
Posted by Colin Lambert. Last updated: September 5, 2022
It is of probably some relief to users of the WM London 4pm Benchmark Fix that after what was a costly July month-end, with savings in excess of $1,000 per million in several currency pairs, the August fixing was much quieter, and demonstrated lower potential savings – but savings nonetheless – using a longer window.
In fact August was the quietest month for potential savings using the Siren fixing, as opposed to WM, in the 17 months since The Full FX started tracking this data, at “just” $239 per million for flow completed correlated with the direction of the Fix. The previous low was $312 per million in May 2022. The average saving across the 17 months is $744 per million.
There were still, however, significant savings in excess of $300 per million, available in the most traded pairs, namely EUR/USD ($308 per million), USD/JPY ($375) and Cable ($334). USD/NOK, in contrast, which often offers the highest savings, was this month the lowest at just $24 per million.
To provide more context, the table also presents projected dollars per million savings across a portfolio of different pairs using a correlation with the Fix calculation, depending upon how much flow was in the direction of the market, or “with the wind”.
| August 31 |
| CCY Pair | WMR 4pm Fix* | Siren Fix | 100%** | 80% | 70% | 60% |
| EUR/USD | 1.00555 | 1.00524 | $308 | $185 | $123 | $62 |
| USD/JPY | 138.625 | 138.573 | $375 | $225 | $150 | $75 |
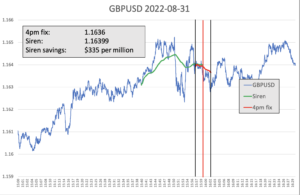
| GBP/USD | 1.1636 | 1.16399 | $335 | $201 | $134 | $67 |
| AUD/USD | 0.68555 | 0.68582 | $394 | $236 | $157 | $79 |
| USD/CAD | 1.3096 | 1.30973 | $99 | $60 | $40 | $20 |
| NZD/USD | 0.6131 | 0.61318 | $130 | $78 | $52 | $26 |
| USD/CHF | 0.97595 | 0.97607 | $123 | $74 | $49 | $25 |
| USD/NOK | 9.9241 | 9.92386 | $24 | $15 | $10 | $5 |
| USD/SEK | 10.6333 | 10.6295 | $357 | $214 | $143 | $71 |
| Average | $239 | $143 | $95 | $48 |
*According to Raidne calculation using NewChange FX data
** Savings are in dollars per million by percentage of correlation to the Fix flow. Blue cells signify a projected saving using Siren, Red cells a saving using WMR
A clue to the reduced savings may be found in the Cable chart below, which exhibits two sharp reversals during the pre-hedging window – both times after a 20 point run higher. Contra-flow could be entering the market as participants took advantage of the rally, it could also be that flows were lighter than usual and the speculators were mis-directed by early moves in the pre-hedging window. Either way, it is interesting that there appear to be two attempts to buy Cable in the pre-hedging window, but that the actual flow would appear to be selling during the calculation window itself.

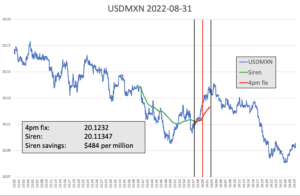
Every month, The Full FX is selecting an emerging market currency pair at random, and before the data is available, to broaden the analysis – this month the selected pair is USD/MXN. Data is again provided by Raidne according to the same guidelines in place for the regularly reported currency pairs.

Interestingly, given how the EM pairs over the 17 months have rarely behaved in the same manner as the majors, USD/MXN also appears to have had a sharp reversal in the minutes leading up to the calculation window, although what appears to be the general trend of USD buying resumed during the window itself. The potential savings of $484 per million are just under half the average for the EM pairs selected across the 17 months, but nowhere near the lowest savings previously recorded.

