NZD Month End Fix Print Highlights WM Methodology Concerns
Posted by Colin Lambert. Last updated: May 14, 2024
Across the 37 months that The Full FX has been publishing data on the month-end Fix, there have often been anomalies between the 20-minute calculations from Siren FX and the five-minute from WM. Much rarer, however, is a difference between the Siren and WM five-minute calculations – but that was the case with the NZD/USD on 30 April, where the difference was more than one pip.
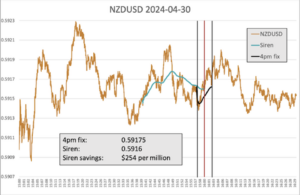
Sources confirm to The Full FX that the WM NZD/USD Fixing rate was 0.59175, however using the regular Siren FX calculation, the five-minute fixing comes out at 0.59162. Siren FX uses data from New Change FX, which captures data more frequently and across a wider range of data sources than WM, which uses LSEG Matching (the predominant platform for the NZD calculation), EBS Market and Currenex.
Enquiries by The Full FX suggest that few, if any, queries have been raised by the WM print, possibly because it was, overall, a much quieter month end than normal – the total spread barely above four pips. That said, it is a matter of concern in some circles, that the WM print can be that far away from what appears to be a straightforward TWAP calculation.
The chart for the Kiwi indicates it was a very quiet five-minute window, with the price dipping initially, then recovering. The difference between a straight TWAP calculation, as performed by Siren FX using the New Change FX data, and what was published by WM, could highlight a quirk of the calculation methodology, in that there were more traded rates at, or near the high during each second snapshot.

Source: Siren FX
In its methodology paper, WM stresses that as a snapshot, not every traded rate will be captured, rather it takes a single traded rate each second from the three platforms of record. “…[T]his will be identified as a bid or offer depending on whether the trade is a buy or sell,” the methodology paper states, adding, “A spread will be applied to the trade rate to calculate the opposite bid or offer. The spread applied will be determined by the order rate captured at the same time.”
WM adds that all captured trades will be subjected to validation checks, which may result in some captured data being excluded from the calculation.
It is relatively rare that such a stark anomaly appears in the month-end data, however it could be something for WM to look into. As a quant analyst at a bank says, “If what happened was down to a series of trades being captured that were at the highs in a particular second, then it highlights the need to capture more data, more frequently.”
The challenge for WM in capturing data at higher frequency is that the majority of the currency pairs it publishes a benchmark rate for, struggle to trade every second, let alone every quarter or half second. This would mean it would be relying even more on non-traded rates – and again, these are often not updated with high enough frequency.
It could develop different methodologies for “major” and “minor” currencies to account for the different qualities and quantities of data available, however WM has historically been reluctant to fragment its methodology to maintain ease of use. Given the much higher volumes traded in, for example the G7 or G10 pairs, there may be an argument for capturing data on a more frequent basis. Both Matching and EBS publish data at a higher frequency, perhaps an idea is for WM to take a 25 millisecond snapshot instead of one second?
Either way, it is probably worth WM investigating how, if at all, it can benefit from higher frequency data, this latest anomaly happened in a currency pair that is busy, but by no means the busiest, in FX markets. In this case, the difference between the Siren FX TWAP calculation and the WM represents $200 per million in execution cost. In the Kiwi, this may not matter too much, but if it happens in EUR/USD or USD/JPY, or at any Fix where billions are traded, then it becomes a real worry.
