FX Turnover Drops from April: Up Year-on-Year
Posted by Colin Lambert. Last updated: February 8, 2023
With all but the Japanese data published, the latest regional FX committee FX turnover surveys indicate that activity in markets dropped from last April, when the Bank for International Settlements took its triennial measure, but was largely up compared to October 2021.
Overall activity was higher year-on-year in every centre with the exception of the US, which drifted 1.3%. In the UK average daily volume (ADV) was 4.8% higher at $2.889 trillion per day; in Singapore it was up 8% to $857.6 billion per day; in Hong Kong it was $591.5 billion per day (up 0.3%); while in Australia (up 9.9% to $147.7 billion) and Canada (up 8% to $168.5 billion), activity was also healthily higher.
Compared to April 2022, and the FX industry’s triennial benchmark from the BIS, activity was down 11.7% in the UK, up 2% in the US, down 5.6% in Singapore and down 14.8% in Hong Kong. In Australia activity from the BIS month was down 1.8% and Canada, like its southern neighbour, saw a healthy increase of 12.8%. It should be noted that a large part of the increase in Canada was the result of an almost trebling of daily turnover in currency swaps.
Options Going Strong in the UK
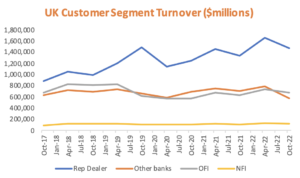
The UK remains, comfortably, the world’s biggest FX market and it was notable that a large proportion of the growth came in the spot market, with $902.5 billion per day in turnover, up an impressive 23.7% from the previous October – the impact of real, sustained volatility in a hard number.
The growth came from multiple sectors, most notably Reporting Dealers (up 43.5% to $444.5 billion), suggesting more active hedging programmes on the part of the major LPs. Although the BIS Triennial Survey highlighted a decline in activity in the sector, sales teams will be pleased to see that Other Financial Institutions (OFI) in the UK were also up, by 16.5%, to $278.4 billion per day.
Non-Financial Institutions (NFI) activity was also up strongly, by 32.8% to $36.8 billion per day, however unlike the other two counterparty segments, this was down on April 2022. The only segment to see a year-on-year decline in the UK was Other Banks, with activity dropping 6.8% to $142.9 billion, this was also significantly down on April.
Another sign of the impact of higher volatility and trend was a sustained performance by FX options in the UK report. Activity registered its highest level since the surveys began, and probably since FX options were first traded, in April 2022, and to a large extent that was sustained in October. ADV was $163.5 billion, 38.7% higher than the year before (but below April’s $170.4 billion mark). Again, the only segment to see a drop was Other Banks – and that by a fraction (1.7%) to $12.3 billion per day. Reporting Dealers’ activity was $80.2 billion (up 30.2%), while OFI daily volume was $58 billion (+52.7%) and NFI $12.9 billion, which is not only more than double October 2021 turnover, but is also the highest ADV ever recorded by FX options in the UK survey.
There was mixed news in outright forwards and NDFs, with activity going in opposite directions. Outright forwards ADV was $308.4 billion in October 2022, a drop of 5.5% from the previous year, while NDF activity – no doubt to the joy of the many platforms chasing this business – rose by 13.5% to $143.8 billion.
In NDFs there were good increases in activity by Reporting Dealers (+14.5% to $87.8 billion); OFIs (+32.9% to $31.1 billion) and NFIs (+47.3% to $13.9 billion); but again, the Other Banks category saw a large drop, almost halving to $12.9 billion from $23.2 billion in October 2021.
Finally, in the UK, FX swaps activity declined across the board, with total ADV of $1.33 trillion, down by 6.9% year-on-year (and down 21.1% from the April survey), with all counterparty segments trading less. Reporting Dealers remain the largest counterparty segment at $758.2 billion per day (-3.2% year-on-year), followed by Other Banks at $379.5 billion (-12.2%), OFIs at $146.3 billion (-9.6%) and NFIs at $45.9 billion (-10.5%).
Spot, Options, Also Driving US
It was a similar picture to the UK in the New York Foreign Exchange Committee’s report, which has not always been the case in recent years where surveys have shown some divergence. Here though, there was increased activity in both spot and FX options, and a decline in FX swaps, outright forwards and, indeed NDFs.
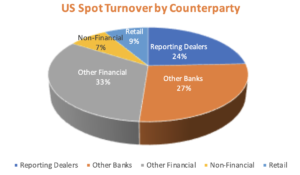
Spot ADV was $424.8 billion, up 6.4% on the previous year (and also up on April 2022’s reading). Be it the attraction of crypto to the prop trading firms which have historically been a significant part of the US spot market, or just declining activity on their part, but OFIs was the only segment to see a decline in activity from October 2021 (it was up on April 2022, however). OFI remains the largest segment in the US spot market at $152.6 billion per day (-6% year-on-year), followed by Other Banks at $124.8 billion (+7.9%). Reporting Dealers were at $112.9 billion, up 17.6% and the first time this segment has executed over $100 billion since the October 2014 survey. NFI activity was $34.5 billion up 37.3% from October 2021.
As was the case in the UK report, the sustained volatility brought more FX option trading in the US, with all segments contributing to the growth. Overall ADV was $63.6 billion, up 38.6% (also up on April), with activity centring around OFIs (+52.3% to 22.6 billion) and Other Banks (+44.1% to $21.8 billion). Reporting Dealers (+10.9% to $12.3 billion) and NFIs (+42.1% to $6.9 billion) were also up.
Unlike in the UK, outright forwards and NDFs both saw a drop in activity, the former by 5.3% to $133.2 billion, the latter by just $66 million per day to $45.8 billion. All of the increase in activity across both products (the FXC report does not break down counterparty segments for NDFs for some reason) was between Reporting Dealers (+34.1% to $28.2 billion) and Other Banks (+33.4% to $29.2 billion), however most activity is still with OFIs at $100.6 billion (-15.5% year-on-year). NFI turnover was $21 billion, down from $24.5 billion in October 2021.
The FX swaps market in the US also dropped, ADV was $309 billion in October 2022, down 13.7% year-on-year, with all segments seeing a decline. Other Banks are the busiest segment here at $117.9 billion per day (-14.7%), followed by Reporting Dealers at $98.2 billion (-1.4%). OFI activity dropped 25.5% to $74 billion, while NFI ADV was $18.8 billion, down 9.7%.
In Canada, activity declined across the board, with ADV in spot at $19.6 billion (-3.4%), outright forwards at $15.9 billion (-3.6%), FX swaps at $113.9 billion (-8.5%) and FX options at $3.9 billion (-9.3%). As noted, there was a significant increase in currency swap activity in Canada, volume reported as $12.4 billion per day, almost three times that in October 2021 and far above the previous $4.7 billion peak in October 2019.
Asia Continues to Build Influence
The three Asian centres to report data thus far all saw an increase in activity, although there were some regional variations in where it was generated from. Singapore remains the largest Asia centre (barring a major surprise from Japan) with all products except FX swaps growing year-on-year.
Spot turnover in the city state rose by 26.7% to $210.4 billion per day, second only to the record mark set in April 2022 of just over $241 billion. Outright forwards, which presumably includes NDFs (the Singapore survey does not break our counterparty segments or NDFs) rose by 8% to $147.1 billion, while FX options activity was $71.5 billion per day, an impressive 50.4% increase. Both outrights and FX options activity represented a new high for the centre. FX swaps, Singapore’s largest FX market, saw activity drop by 4.1% to $420.4 billion.
It was more of a mixed picture in Hong Kong, which saw an increase in spot activity, but a decline elsewhere. Spot ADV was $116.7 billion, a 16.4% increase from October 2021 (but down from April 2022), while FX swaps – the largest FX market in the centre – saw activity drop 4.6% to $363.5 billion. Outright forwards SDV was $48.6 billion, a 32.4% decline, while FX options activity was a fraction lower at $20 billion, from $20.2 billion the year before.
Finally in Asia, notwithstanding the pending Japanese release, Australia saw healthy gains in all products, even FX swaps, the latter recording ADV of $79.4 billion, an 11.1% increase on October 2021. The majority of the increase in Australian FX swaps turnover was from local financial institutions.
Spot ADV was $43.1 billion, up 7.1%, while outright forwards was $20.7 billion, an increase of 10.9%. FX options activity also climbed in Australia, from just over $1.2 billion per day, to just under $1.5 billion.
This story will be updated upon the release of the Japanese data


