FX 2021: How Has the Pandemic Affected Trading?
Posted by Colin Lambert. Last updated: August 31, 2021
In the first of a two part series, The Full FX takes a look at some of the broader impacts from the pandemic on the foreign exchange industry.
More than one year on from the onset of the global pandemic, data indicates that the buy side is having an even greater influence on the FX market than before, but the channels they are using are changing – sometimes dramatically – and, as often seems to be the case, growth is not across the board both in product and segment terms.

The semi-annual FX turnover reports from the UK FX Joint Standing Committee (JSC) and New York Foreign Exchange Committee (FXC) provide a detailed look at customer behaviour during the survey month and comparing the recently released data, from April 2021, with that of October 2019, the last before the pandemic broke, the growth in overall activity seen is largely the result of non-reporting market participant – customer – activity.
The exception to the rule is the FXC report, within which, the Reporting Dealer segment was actually the second strongest, growing 8.7%, only bettered by the Other Banks segment, turnover from which grew by 12.6%. This would support anecdotal evidence that internalisation works less well once the UK market has closed and that dealers seek to offlay risk with each other more regularly. In the UK, the Reporting Dealer segment is steadier, activity in this group falling by 1.8%.
It should be noted that in every product group in the UK, except for outright forwards, the main dealers still represent the majority of activity – albeit by a diminishing margin. In the US the reverse is the case, Other Financial Institutions (OFI) dominate in every area except for FX swaps, suggesting that non-bank market makers represent a much larger chunk of the market in this centre.
Customer Growth
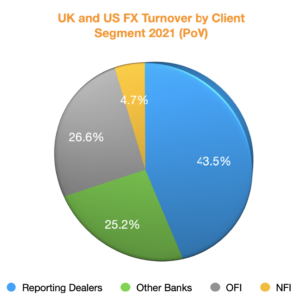
Across the UK and US reports, together the two centres represent some 60% of global FX turnover, customer activity was $2.234 trillion per day, a 9.5% increase from the October 2019 report. The bulk of this activity was in the UK, which saw a fraction shy of $1.5 trillion per day, a 10.8% increase, FXC reports activity rising 7% over the same time frame.
The majority of the growth in customer trading came from two segments – other banks and OFI, the latter being made up of hedge funds, asset managers of all types and non-bank participants that use a prime broker. Across the two reports, Other Banks turnover rose 11.4% to $997.2 billion per day, while OFI activity was $1,049.2 billion, a 10% increase. The Non-Financial Institutions (NFI) category, typically corporates and government agencies, saw a slight 1.6% decrease in activity to $187.6 billion – all of the decline was in the US report.
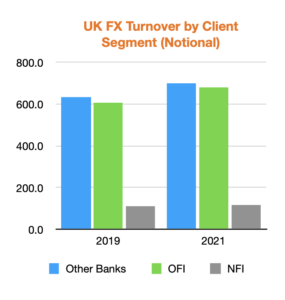
In the UK, OFI turnover rose by $72.3 billion from October 2019 to $682.1 billion, while that with other banks almost matched it with an increase of $68.7 billion per day and remains the largest customer segment with average daily volume (ADV) of $701.9 billion.
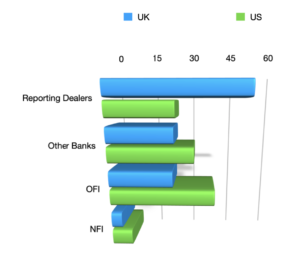
As noted, in the UK at least, reporting dealers – 27 of the them, compared to 21 in the US – still make up the majority of activity at 56.5% of all volume, however this has dropped quite sharply from the 60.3% share the major dealers had in October 2019. In the US, the major dealers have long had less of a role to play – non-bank firms are anecdotally a much larger part of the spot market especially there – although, paradoxically, the share of this group actually rose fractionally to 38.7% from 37.2%. All Reporting Dealers in the UK and US are banks.
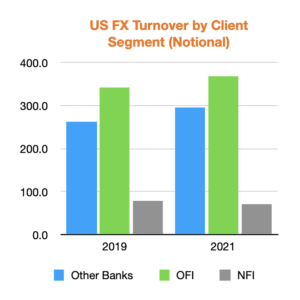
Reflecting the greater role played in the US by OFIs, largely the aforementioned non-bank players, 38.0% of FX activity in North America is executed by this group, this is slightly lower than October 2019 (38.6%), suggested there may have been a small, but discernible, “flight to quality” in terms of counterparties during the pandemic. In the UK, Other Banks and OFIs have a broader similar share of turnover, the former at 23.5% (up from 22% in October 2019); the latter at 22.9% (21.2%). In both centres, NFI counterparties remain the smallest segment, responsible for 3.8% of flow in the UK (unchanged from October 2019), and 7.4% of flow in North America (down from 9.0%).
Product Sets
With the exception of NDFs and FX options, customer segments had a higher share of activity in the UK across product sets comparing October 2019 to April 2021, while in the FXC report things were a little more mixed.
In the UK spot market, while Reporting Dealers remain the largest segment with 41% of all flow, this is down quite sharply from pre-pandemic levels of 44.6%. The second biggest segment remains OFI, with turnover of $272.4 billion per day (33.7% of spot volume), up from $228.8 billion in October 2019 (30.3%). Other Banks’ share of spot turnover was steady at 21.4%, however in notional terms it rose by some $11 billion per day to $172.6 billion. Non-financials’ turnover was $31.4 billion, up from $27.2 billion and in market share terms, up 0.3% to 3.9%.
The FXC report in the US was broadly similar in terms of trends, Other Banks’ share ticked by 0.2% to 30% in the latest report with turnover rising just under $9 billion per day to $115.3 billion, while OFI activity grew by just under $16 billion to $157.3 billion per day – this segment’s share rising to 40.9% of spot activity from 39.5% in October 2019. Unlike in the UK, NFI turnover fell in North America, from $27.3 billion to $24.5 billion per day in the latest report. This is a market share of 6.4%, down from 7.6%; Reporting Dealers’ share also declined, but not as much as in the UK, in North America it fell to 22.7% from 23.1%.
The story on outright forwards is less clear, thanks mainly to the FXC report not breaking NDF turnover out across customer segments as the UK’s JSC does. In what might be food for thought for those platforms seeking what is widely regarded as an NDF gold mine, turnover in this product declined in the UK, driven exclusively by reduced activity in the customer segments. Turnover between Reporting Dealers actually rose by just over $2 billion per day in the UK from October 2019 to April 2021, and this segment’s share of activity rose commensurately from 56.4% to 61.6%. Turnover with Other Banks fell just about $4 billion per day to $16.5 billion, its share of activity also dropping from 15.5% to 13.3%, while OFI activity fell by $1.7 billion per day to $22.3 billion (its share dropping from 18.2% to 17.9%). Activity from the NFI sector fell from $13 billion to $9 billion per day, its share also falling from 9.9% to 7.2%. If sustained, this trend would suggest that several of those platforms chasing the NDF dollar are destined to come up short.
On outright forwards in the UK, Other Banks (+3% to 10.5% of activity) and OFI (+1.2% to 51.2%) both saw increased activity, while NFI turnover rose fractionally, by $100 million per day) but its share declined to 4.7% from 4.8%. Here, Reporting Dealers saw their share fall from 37.7% to 33.7%. In the FXC report, which bunches NDFs in with outright forwards, there was a decline in activity and market share of Reporting Dealers (by 2.8% to 11.2%) and Other Banks (-1.2% to 12.4%), while OFI (+3.3% to 63.5%) rose strongly, and remains the largest trader of this product at $116.4 billion per day. NFI activity was barely changed at +$100 million per day to $23.7 billion, however its share of activity increased slightly.
Again reflecting the different make up of the two centres, FX swaps activity in the UK rose across customer segments, and was down between Reporting Dealers, while in North America it rose between this segment, as well as Other Banks, but declined with OFI and NFI.
In what again may be a guide for those platforms seeking to build a strong FX swaps’ franchise, the vast majority of trading in the UK involves Reporting Dealers and Other Banks. Together, these two segments make up 85.1% of all activity, or over $1.3 trillion per day. It should be noted that in both notional and percentage of flow terms, the share of Reporting Dealers declined from October 2019 (by some $21.3 billion per day and 3.9%), while Other Banks’ turnover increased by $69 billion per day, its share rising 2.5% to 29.1%. OFI activity was $178.6 billion, up from $151.9 billion (11.3% of activity compared to 10.2%). While NFI turnover was $56.3 billion from $49 billion (3.6% from 3.3%).
In North America, 70.2% of FX swaps business is between Reporting Dealers and/or Other Banks. Activity involving OFI and NFI was more mixed from pre-pandemic levels, in the case of the former notional trading volumes rose by $12.7 billion per day to $79.6 billion, however its share of activity declined to 22.3% from 24.1%, while the latter saw both notional volumes (-$3.6 billion to $19.5 billion per day) and its share (8.3% to 5.5%), decline.
Less competitive in the platform space, however representing a data point that has come as a surprise to some industry participants, FX options activity declined across the board in the UK and North America. In the UK Other Banks’ activity collapsed in a heap, from $31.4 billion in October 2019, to just $13 billion in April 2021, while OFI also declined, by $5.8 billion per day to $43.5 billion, as did NFI activity, by $2.4 billion to $3.8 billion. In market share terms, Other Banks more than halved from 21.2% to 10.2%, while OFI increased slightly from 33.3% to 34% and NFI declined from 4.2% to 2.9%. Reporting Dealers took up a lot of the slack, rising in share terms from 41.3% to 52.9%.
In North America FX options turnover with Other Banks was down $6.8 billion per day to $14.3 billion, while OFI activity declined by $5.2 billion to #13.8 billion, and NFI turnover fell by $2 billion to $4.5 billion. Market share levels were broadly the same in North America, Other Banks declining 1.1% to 34.3%, OFI rising 1.7% to 33% and NFI rising 0.1% to 10.8% – Reporting Dealers’ share was down 0.7% to 21.9%.
Sustainability
The trend of increasing customer influence is not a new one in FX, however it should be noted that in terms of the FX trading and sales businesses of the banks, the OFI data is undoubtedly largely driven by non-bank market makers that are clients of the prime brokerage division, but competitors to the market making business.

Market share of FX turnover by participant (% of volume)
In the UK report, spot turnover that was prime broked, which would include the non-bank firms’ activity, was largely unchanged from pre-pandemic levels – in notional terms it rose by almost $15 billion per day to $353.6 billion, but as a share of spot volume it fell from 44.9% to 43.8%. In North America, spot FX PB volumes are almost as large as they are in the UK – reflecting the larger influence of the non-bank players there – in the latest report average daily volume via a prime broker was $309.7 billion, up from $279 billion pre-pandemic. In market share terms, 80.6% of North American spot activity is via a prime broker, up from 77.9% in October 2019.
Until the release of the next Bank for International Settlements Triennial Survey next year (expected September 2022), it will be hard to ascertain exactly how much OFI volume is from what might be termed traditional customers of the FX trading business. In truth the result is likely to be driven by volatility levels, if it increases more alpha seekers and hedgers will be drawn to the market.
Until that question is answered, however, there are questions for banks facing investment decisions for 2022 – namely is FX a business worth investing in. Revenue numbers would suggest it is, however often a large “soft” client base pumps up the profit figures. It will be encouraging that the one segment that unarguably reflects customers, NFIs, saw activity grow, however in the big scheme of things it remains in the minority.
The picture is further muddied by several banks with specialties or who are treated as customers by the top tier institutions, being Reporting Dealers under the JSC and FXC frameworks.
Overall, however, with FX activity again on the rise, and, perhaps, the vision of interest rate differentials making a long-overdue return to the macro-economic scene, any bank seeking to maintain or grow its position will need to invest. For the top tier, growth seems consistent across the board, with the previous caveat about the OFI numbers, and there are opportunities in trading and sales as well as prime brokerage. Regulation may provide a hit to the system on PB with greater capital costs a factor for all players in FX in 2022, but overall, if the capital is made available, further growth is likely.
For players further down the ladder from the very top of the tree, any investment will likely be more targeted than before, but again, the fact that what are seen as traditional customer segments are growing will be a positive.


