Euronext FX Rolls Out New Market Data Product
Posted by Colin Lambert. Last updated: July 27, 2021
Euronext FX has rolled out a new market data service. Available via GUI or Fix API, the Euronext FX Dashboard combines the firm’s ECN metrics with spot volume and executed trade data from CLS to provide users with an up-to-date and accurate picture of conditions in the market.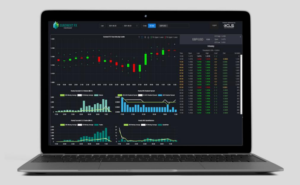
The Euronext FX Dashboard does not fit into what might be termed the traditional market data space, because unlike many other offerings, rather than provide data for pricing engines, it offers a pre-trade analytical view of the market, more aimed at informing before trade execution. “The Dashboard is effectively a pre-trade TCA execution assistant,” says David Lyons, COO of Euronext FX. “We think it offers a different way to add value to all market participants, including Euronext FX clients, by giving them the information they need when deciding how to execute their next trade.”
The Dashboard offers a candlestick chart of price action in each currency pair, as well as executed intra-day volumes from CLS. In addition, average realised spreads from the Euronext FX ECN, the number of CLS settled trades and the average number of quotes per second on the ECN are also displayed, alongside five-day and 20-day moving averages. “The Dashboard provides a high-level view of market conditions,” explains Lyons, “If conditions change, users will be alerted by one or more of the metrics delivered, be it wider realised spreads, increased quote rates, increased ticket numbers or higher volumes. The intent is to fully inform execution desks as to the type of market they are trading into, as well as give them data to help them decide their execution style.”
Clients have a choice of five-minute or 60-minute data update intervals, choice of currency pair grouping and access to the data visualisation tool or Fix API connectivity. CLS market data is currently provided on a 15-minute delay while the settlement services and data provider cleans up the data and separates out spot trades. The Dashboard supports 40 currency pairs settled in CLSSettlement.
Predictions
Working very closely with their quant team, Euronext FX has developed proprietary methodology that offers insight into potential forward-looking market movement, based on observations of historical behaviour. The assessment of potential market movement is non-directional but it can be used as a forward-looking volatility metric.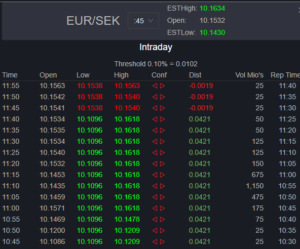
At the start of a 60-minute window, Euronext FX can assess the possibility for the market to move in either direction by + or – a specific percentage value (the % value changes dynamically between 0.1% and 0.2% to reflect recent market conditions). Clients who subscribe to five-minute data have this indicative value updated every five minutes and the potential outer ‘boundary values’ converge as the 60-minute period elapses
To help decision makers, the Dashboard also displays the accuracy of previous predictions, green being accurate, red being a miss. Lyons notes the average accuracy for expected market movements is typically more than 75%, however, the analysis has yet to consider events such as central bank speeches. With a human overlay considering expected market events, the success rate could improve. “We are not predicting direction,” Lyons stresses. “This is about assessing real-time market conditions, comparing against historical patterns of behaviour, and providing an indication of future short term market volatility”
Analysis
The Dashboard could help some buy side execution desks deal with an increasingly common challenge – explaining to internal audit and compliance why they chose a particular execution style for a ticket. Users can zoom in on historical data on the Dashboard to help explain execution style months previously.
Interestingly, the market data, derived largely from CLS volume and trade data, can also highlight the impact of pre-hedging, for example around the London 4pm Fix. By zooming in, users can see the market impact of trades ahead of the window, something that may help build understanding amongst users of the Fix as to what happens in that critical period. Reported executed CLS volume windows are provided.
The Dashboard can also help support the relationship between liquidity providers and consumers – if there has been a burst of trade rejects, the LP can at least point to market conditions as a reason for lower acceptance. Equally, those executing the trades can see their market impact through the prism of the wider market.
Furthermore, the data provided can be the backbone for a conversation between service provider and customers. The latter still like to contact the LP and get market colour, but increasingly in the modern FX market this colour is hard to provide on anything more than an individual institution basis. With over $5.5 trillion settled on average every day, CLS has access to the largest single source of FX-executed data available to the market. By using CLS data, the Dashboard provides a much broader window on the FX market, giving sales desks information to provide to their clients.
“We believe we have developed a market data product that is different and offers a real value add to both buy and sell side,” says Lyons. “We have created different modules so that clients have a choice of data – they can access only Scandinavian and local markets data for example, or G7 and cross pairs.
“We will continue to enhance the Dashboard, this is just the starting point,” he adds. “For now, access to a rolling five-minute window of the largest publicly available trade volume data from CLS, in close to real-time, and the market impact of that volume, provides users with meaningful analytics to help them make more informed decisions about their execution and their trading styles.”