Did FX Turnover Hit $10 Trillion in April?
Posted by Colin Lambert. Last updated: July 23, 2025
The latest semi-annual FX turnover surveys from five of the world’s local FX committees shows an expected volume surge in April, and suggests that certainly on multiple days, but also possible across the month, daily turnover in the global currency markets could have hit $10 trillion.![]()
Five committees, from the UK, US, Singapore, Canada and Australia, have published data showing aggregate volume across their centres was $7.125 trillion in April 2025, almost equivalent to the global figure unveiled in the last Bank for International Settlements’ Triennial Survey of $7.5 trillion. Although the surveys in the UK and US in particular have different reporting methods from the BIS, the 31.1% growth since April 2022 (the month of the last BIS survey) would translate into global turnover of over $9.8 trillion.
Where the $10 trillion threshold could be breached is in the fact that the Japanese and Hong Kong committees have yet to report data – the former continues its idiosyncratic publication method by reporting on 6 August, the latter is not publishing due to its work on the BIS Triennial Survey, which was taken in the same month. If, however, those two centres – indeed other centres covered by the BIS – matched the year-on-year increase reported by the five committees to publish, aggregate turnover will have exceeded $10 trillion.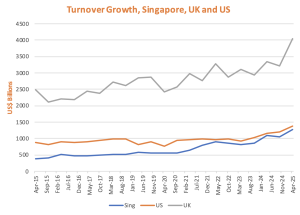
Furthermore, if Hong Kong matches the 20% year-on-year rise from the other centres, it will join the UK, US and Singapore in having daily FX turnover in excess of $1 trillion. All three have reported their highest-ever turnover, which is, naturally unsurprising given the mayhem around “Liberation Day” events.
Risk Drives UK Surge
Just three years after breaching the $3 trillion per-day mark, the UK’s FX Joint Standing Committee report shows the centre breaking above $4 trillion to $4.045 trillion per day, up 20.7% from April 2024. Given the increased volatility, growth was strongest away from the UK’s traditional powerhouse, FX swaps, with spot, outrights and options volumes all rising more than 30% year-on-year.
Spot average daily volume (ADV) was $1.293 trillion, up 31.3% from the year before (and up 42.3% from the previous survey in October 2024), largely driven by trading between Reporting Dealers and with Other Financial Institutions (OFI). The former saw ADV increase by 41.1% year-on-year to $580.6 billion, while OFI turnover rose 47.8% to $442.5 billion. Increased trading by OFIs was highlighted by FX prime brokerage volumes reported in the survey – these rose to $666.2 billion per day, and at 51.5% of spot turnover, PB counterparties now have their highest ratio of activity since the JSC started reporting the data – it is also up from 44.9% in April 2024.
At face value, there is a surprising dip in turnover with Other Banks in the JSC survey, activity dropping 2.2% to $239.3 billion per day, however it should be noted that this is still comfortably up on historical averages, indeed it is only the third time it has exceeded $200 billion as a sector. The drop in activity could also point to a “flight to quality” on the part of counterparties as they sought out what they perceive to be more robust liquidity providers, but it could also be a sign that regional players, especially those in specialised markets, warehoused more risk and internalised it.
In spite of only rising 2.8%, FX swaps remains comfortably the UK’s biggest FX market at $1.563 trillion per day – again there was a drop in turnover with Other Banks (by 12.4% to $410 billion, while OFI activity rose 29.7% to $290.7 billion. Turnover between reporting dealers was up 3.8% at $824.6 billion.
Reinforcing the sense that exchange rate risk drove most activity, while swaps volumes were steady, those in outright forwards surged 46.8% year-on-year with growth seen across the board. Most notably, while still the smallest counterparty sector, Non-Financial Institutions (NFI) activity rose by 53.3%, stressing how these firms sought to lock in hedges. Activity between Reporting Dealers actually outstripped that gain, however, at 62.5% (to $232.8 billion per day), while Other Banks’ turnover rose 38.6% to $37 billion and that with OFI to $267.6 billion, up 36.1%.
Perhaps surprisingly, given how many emerging markets were caught up in the announced US tariffs, NDF growth was more subdued, with activity rising just 13.8% in the UK year-on-year to $223.5 billion. It was a real mixed bag across segments, with Other Banks and NFI activity dropping sharply from April 2024 (by 37.4% and 42.5% respectively), but rising between Reporting Dealers and with OFIs (by 37.7% and 40.9%). Reporting Dealers are the largest segment in this market at $123.3 billion, however it is notable that the percentage of NDF volume PB-ed also rose, from 17.7% in April 2024, to 27.9% in the latest survey.
Finally, and again reflecting the volatile conditions, FX options volumes in the UK went up 48.4% year-on-year to $350.4 billion, the first time it has been above the $300 billion per day mark. Activity was strong across the board, with NFI turnover leaping 156.6% to $19.3 billion per day as corporates turned to options in greater numbers, while OFI also jumped into the market in greater numbers, at $126 billion per day activity was 64.7% higher than in April 2024. Other Banks were responsible for $51.8 billion per day, up 11.4%, and again, prime brokerage played a bigger part, with 49.9% of activity via a prime broker, up from 39.6% in April 2024.
US Driven by Spot, Outrights
Total daily turnover in the US, according to the New York Foreign Exchange Committee’s survey, was $1.378 trillion in April, a new high for the centre at up 18.3% year-on-year – the US has also extended its run of $1 trillion-plus surveys to four. While there was growth across the board it was most notable in spots and outright forwards, another standout is the absolute dominance of PB in the US spot market – highlighting the role of non-bank market makers in the centre.
ADV in spot in the US was $602.3 billion, the first time above $600 billion, up 22.3% year-on-year. Unlike in the UK, OFIs remain the largest counterparty in the US at $223 billion per day of spot, up 26.8% year-on-year. Reporting Dealers are next at $183.1 billion (up 34.2%), with Other Banks up 7.9% ($145.9 billion) and NFIs at $50.4 billion (+22.3%).
The data for Reporting Dealers probably represents a great deal of trading with each other as prime brokers, however, for while this sector has a 30.4% market share, 96.6% of spot activity in the US is via a prime broker, up from 92.5% in April 2024.
PB plays less of a role in outrights, 44.5% of activity is prime broker in the US, however, OFIs remain the most dominant sector at $147.6 billion per day, up 19.2% year-on-year. There was a surge in outrights trading between reporting Dealers of 68.4% to $57.8 billion, while Other Banks’ activity drifted 3.6% to $35.5 billon (still the third highest since reporting began) and that with NFIs at $31.1 billion, up 24.9%.
NDF volumes in the US rose 14% to $78.7 billion, however the FXC report does not break this out into sectors in its report, rather the outright/NDF product suites are bundled together for volume and counterparty reporting purposes.
Unlike in the UK, NFIs in the US did not increase their activity in FX options (although they may have traded earlier in their day with the UK of course), activity dropping 1.9% with this sector to just shy of $5 billion per day. OFI volumes rose by 24.6% to $40.4 billion, while that between Reporting Dealers soared 68.3% to $29.7 billion. Other Banks also turned away from options, perhaps reflecting lower activity from their own corporate client bases, activity dropped 39.3% from April 2024 to $15.6 billion per day. This is up on the October 2024 report, but lower than average compared to the past five years.
Finally in the US, FX swaps volume rose 11% to $412.8 billion, with activity largely driven by Other Banks (+4.8% to $144.5 billion), Reporting Dealers (+21.7% to $136.2 billion), although NFI volumes rose 24.8% to $24.8 billion and that with OFIs by 5% to $107.2 billion.
New Highs for Singapore, Canada and (Nearly) Australia
Singapore has likely reinforced its position as the third largest FX centre, assuming nothing significant emerges from the Hong Kong report when published, and remains hot on the heels of the US in terms of ADV, which hit a new high for the centre at $1.273 trillion – the third consecutive survey above $1 trillion and up 17.3% year-on-year.
The Singapore FX Committee survey offers much less detail than those in the UK and US, however volumes in spot, swaps and options were all at new highs, while outright activity was at its second highest.
Spot ADV was $329.1 billion, the first time above $300 billion in the city state, up 30.8% year-on-year. While outrights activity was only at the second highest (behind October 2024), at $189.8 billion per day (+21.9% year-on-year) it is at its second highest in Singapore, while FX swaps ADV was $620.8 billion (again, the first time above $600 billion as well as up 5.2%), and FX options broke $100 billion for the first time at $102.5 billion, a 36.1% rise. Currency swaps ADV also rose strongly, by 155% to $30.8 billion.
Volume in Canada was slightly above the previous survey’s levels, and at $228.6 billion is at a new high for the centre, as noted. The largest growth was in spot, perhaps unsurprisingly given Canada’s prominent role in the US tariffs issue, where activity rose 58.1% to $32.1 billion per day. Outrights were also higher, by 22.2% to $24.2 billion, again a new record high, however FX swaps, while rising 4.6%, at $144.7 billion are down on October 2024’s levels.
Derivatives activity rose strongly in Canada, FX options ADV was $6.2 billion per day, up 21.6% year-on-year, while currency swaps volume rose 45.6% to $21.4 billion. Both are new highs for Canada.
Finally in the group to report, the Australia FX Committee says that $200.7 billion was traded in Australia in April, up 25.1% year-on-year and the second highest ever for the centre, behind April 2011. Spot ADV was $50.6 billion, up 15.5%, while outright volume rose 41.5% to $35.7 billion – both are new highs for the centre.
FX swaps ADV rose 24.2% in Australia in April to $107.2 billion, however this remains well below activity levels seen up until 2013. FX options volume was $1.2 billion, up 16.2% but well below historical highs, while currency swaps ADV was just shy of $6 billion, a 48.8% year-on-year increase.
Overall the reports paint a healthy, if potentially misleading, picture for the FX market. Activity soared but was clearly boosted by the surge in volatility early in the month. Without doubt, the market saw multiple $10 trillion days during that period, and it will be interesting to see what data the BIS publishes in September. The likelihood is that the number will be north of $9 trillion, but below 10, it is also likely that, barring further market mayhem in a survey month, that what will be a new high-water mark will stay in place for some time, certainly across the FX committee surveys, if not the BIS Triennial Survey.