Latest FX Execution Data Reinforces the Push to Competition
Posted by Colin Lambert. Last updated: August 11, 2023
With volatility lower in April 2023 than the previous April, more customers turned to competitive channels to execute their FX business according to the execution data within the latest semi-annual FX turnover survey from the UK’s FX Joint Standing Committee (JSC).
The data breaks down counterparties into four segments, three of which can largely be termed “customers”, with the fourth, Reporting Dealers, more likely to be a blend of “customer” and “market maker” according to the market being traded. Looking at the three outright customer segments – Other Banks, Other Financial Institutions (OFI) and Non-Financial Institutions (NFI) – there was a divergence in their execution channel of choice, with Other Banks increasingly using direct channels to the major dealers, but OFIs and NFIs putting more of their business in competition.
Underpinning the subtle shifts, it is noticeable that activity between Reporting Dealers continues to make up the majority of FX volume in the UK, indeed it has actually increased to 58.8% of all products in April 2023, from 58.4% in the April 2022 report. Even here, however, more volume is going into competitive channels, with the multi-dealer platform (MDP) channel attracting significantly more volume, $232.9 billion per day from $194.6 billion in April 2022. This is matched by a slight increase in volume through inter-dealer brokers, where Reporting Dealers traded $609.4 billion in April 2023, compared to $595.6 billion the previous year. In percentage of flow terms, these firms executed 10.9% of their FX business on MDPs (up from 8.7% in April 2022), and 28.5% via brokers (26.5%).
April 2023 was clearly a good month for the brokers, because it was the most popular channel for Reporting Dealers, followed by direct (probably via chat and conversation channels) at $587.9 billion (27.5% of all volume); Electronic Broking at $444.3 billion (20.8% of flow, up from 17.8% in April 2022); and single dealer platforms (SDP) at $189.6 billion, or 8.9% of flow, lower than the channel’s share in April 2022, when it stood at 10.4%.
Although volumes involving Other Banks dropped overall, there were shifts in shares of each channel from this group. There was a sharp drop in Other Banks’ volume through the Inter-dealer direct channel in the last survey and the levels are maintained in the April 2023 report, this means a drop of almost $35 billion per day in the report, which is likely the result of previous mis-reporting.
Elsewhere, Other Banks executed less volume through the Customer Direct channel (however the percentage share of the group’s volume held by this channel rose to 32.6% from 29.5% the year before), and it was a similar picture on SDPs with notional volumes dropping very slightly ($2 billion per day) but the share rising to 11.1% from 9.6%.
It is noticeable that while Other Banks slightly increased notional volumes through MDPs (up $2.3 billion per day to 12.3% of volume from 10%), activity on the electronic broking platforms fell by some $21 billion per day – because of the lower overall activity from this segment, however, this only means a drop in the channel’s share to 16.3% from 16.6%.
Customers Chasing Competition
It is noticeable in the latest JSC report that more customers are turning to competitive channels to execute their FX business, largely, one suspects, because conditions are calmer than April 2023 when the market was still dealing with the onset of the Russian invasion of Ukraine.
Overall, OFIs were responsible for 21.1% of activity across all products, up from 19.4% in April 2022. This widens the gap between this segment and Other Banks, whose collective activity was 16.8% of volume in the latest survey, down from 18.8% in the previous April.
Conversely, reinforcing a longer-term trend, NFIs were responsible for 3.3% of volume, down from 3.4% in April 2022.
Both OFIs and NFIs used the direct channels to their dealers less in the latest survey period with the Customer Direct channel seeing sharply lower volumes, and percentage shares of activity. OFI volume through this channel dropped by some $33 billion per day, taking the channel’s share of activity from this customer segment to 24.3% from 29.5%, while NFI volumes dropped by $10 billion per day for a 27.9% share, down from 32.8% in April 2022. 
Sales desks need not worry too much, however, for the direct channel remains the most popular for NFIs, although the gap to the second preferred channel, MDPs, is narrowing. In the latest survey 23% of activity from NFIs went down this channel, up from 19.8% in the April 2022 survey, however notional volumes were only up by some $1.5 billion per day.
OFIs also used the MDP channel more in the latest survey, executing some $191.5 billion per day (compared to $27.3 billion from NFIs), up from $174 billion in April 2022. The share of this channel from OFIs increased to 24.9% from 23.3%.
The decline in direct bilateral business was also noticeable in the SDP data, with OFIs executing slightly less in April 2023 ($109.6 billion), but the channel’s share of activity from this segment falling to 14.3% from 14.9%; while NFI activity dropped both in notional terms, by $3.3 billion per day, and share terms, 15.1% of volume from 16.2%.
Somewhat strangely, given how access to the channel is limited, both OFIs and NFIs increased their activity level through the brokers – the former executing $97.9 billion per day (12.8% of all volume), up from $68.1 billion in April 2022 (9.1%), while the latter traded $1.2 billion per day more at $18.4 billion, its share rising to 15.6% from 13.2%
Reinforcing the good month for brokers is perhaps another outlier – one that has been seen before in the UK report, however – with spot volumes more than doubling to $92.7 billion (9.2% of volume), from just under $40 billion in April 2022 (3.9% of volume). This last happened in 2018, when spot volumes were also reported in the $90 billions in both April and October, after a prolonged period around the $40 billion mark in previous surveys. As was the case in 2018, market sources are somewhat mystified by the jump in spot FX brokerage volumes, although one trader believes it may be banks pushing 4pm Fix flow to a voice broker for matching ahead of the fixing window.
ECNs Still Rule in Spot
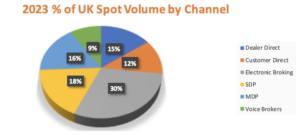
While their share of the market continues to drift lower, ECNs remain the channel of choice for most spot traders, these venues executed 29.6% of spot volume in April 2023, down from 32.2% in April 2022. SDPs also saw their share of spot activity decline, but remain the second most popular channel at 17.6% (down from 19.4%), however MDPs are catching up fast, grabbing a 16.5% market share in spot, up from 14.4% in April 2022. Inter-dealer direct activity in spot was broadly unchanged, while the Customer Direct channel saw a decline in share to 12.2% from 15.3%. As noted, spot brokers saw their share jump, to 9.2% of activity from just 3.9% in the previous survey.
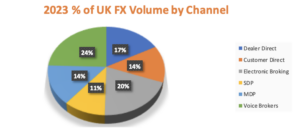
Across all FX products the picture is more even, brokers have regained top spot from ECNs after the latter popped into the number one slot in the October 2022 survey. Brokers handled 24.5% of all FX business in the UK in April 2023 (up from 23.1% in April 2022), while ECNs were at 19.8% (17.9%), Inter-dealer Direct at 17.1% (19.5%), MDPs at 14.5% (12.1%), Customer Direct at 13.5% (16.1%) and SDPs at 10.6% (11.3%).


