BestX RFQ Par Introduces a New Way to Look at Hit Ratios
Posted by Colin Lambert. Last updated: June 10, 2021
The relationship between sell and buy side in FX markets has been eased in recent years by the advent of better data and analytical tools, however this evolution has itself created occasional tension thanks to different interpretations of the data. One instance of this is hit ratios – a buy side client, or a third party, can provide a liquidity provider with their win rate, but is it a true reflection of that LP’s efforts?
As an LP, the level of competition is important, winning 30% of a client’s flow in a panel of two LPs is radically different from the same win ratio on a panel of eight LPs. A buy side firm could be asking an LP to pick up their game, but for the LP to truly understand the scale of the problem – if it even exists – they need to understand the size of the client’s panel.
To meet this need and to help clarify matters even further, BestX has enhanced its methodology with the release of RFQ Par, a new analysis tool that provides an expected win rate relative to the panel size, thus enabling LPs to better understand their level of performance with clients.
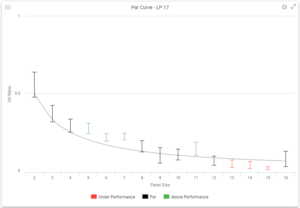
Although there is no little complexity behind the analysis, the concept is, at heart, a simple one – the par rate is directly related to the panel size as a basic 1/X calculation. The bigger the panel, the lower the par score – or expected win rate. “The point is to build a more intelligent hit ratio,” explains Dean Markwick, quant at BestX. “Currently hit ratios are too simplistic because they look at how many trades there were and how many did an LP win? This is the first offering to take panel size into account.”
The roll out enhances an important element of the BestX service, while it offers value for sell side institutions, much of the development in recent years has been buy side focused. “We have always wanted to deliver bespoke IP that is not common to buy and sell sides,” says Ollie Jerome, co-founder of BestX. “As the app has become more sophisticated this has allowed us to roll out services like RFQ Par. Our data set means our analysis has statistical significance and we wanted to deliver a real value-add to our sell side clients, whilst also providing a more powerful analytical tool for the buy side.”
“The point is to build a more intelligent hit ratio. Currently hit ratios are too simplistic because they look at how many trades there were and how many did an LP win? This is the first offering to take panel size into account.”
At a top level, the app looks at all LPs and their hit ratios relevant to the various panel sizes, this provides the Par score for that panel size. This enables BestX to deliver analysis to help LPs build a picture of where they are winning trades and in what environment? Some, no doubt, will perform better in smaller panels, but others may thrive in a more competitive landscape. Users can also see if there are times of the day and certain currency pairs in which they are under- or out-performing. Equally, the new service provides a reference point for clients to analyse specialist LP performance – in specialist currencies, an LP would be expected to outperform, this allows the client to overlay their own judgement of how much that outperformance should be.
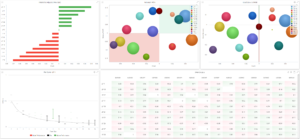
The data is displayed graphically so LP performance is directly comparable according to the various criteria, it can also be filtered into currency pair or groups of pairs, tenors, time of day and ticket size. While this allows the buy side firm to better understand where the real value is being delivered by its LPs, the data can also be delivered in an anonymised fashion for sell side firms to assess their own performance.
“We also highlight any statistical uncertainty and make sure clients are looking at sensible data sizes when conducting their analysis,” explains Markwick. “RFQ Par has been designed to easily show users where there is less data when estimating hit ratios.”
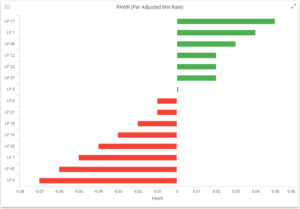
In simple terms, RFQ Par delivers a bar of performance, when the the upper or lower bars are above/below the par rates, that indicates an over/under performance on a statistically significant data set (which is driven by trade numbers). Curves are available to provide more details, but as Markwick observes, in reality most users want to judge counterparty performance. To deliver this BestX has developed the par-adjusted win ratio (PAWR), which takes the win rate, adjusts it by the par score and then weight it by the notional won. Above zero and the LP is doing well, below is a different story.
All data can be granulated according to the client’s needs it can also be downloaded to a PDF for a counterparty report to take to a meeting.
Clarity
If nothing else the new service should help buy and sell side have even better, more informed conversations. It also helps buy side firms track any changes in LP behaviour – for instance if an LP is making a push in certain currency pairs or centres. “Understanding trends is quite important in this type of analysis,” says Markwick. “You need to look at PAWR over time and see how counterparty performance changes. An LP might set itself out to win more business in certain pairs or ticket sizes, this also helps them understand how successful they have been.”
Perhaps the most important aspect of building stronger relationships is how the information can be delivered anonymously. By providing information about panel size without actually revealing how many LPs a firm is in competition with (the data is relative to average panel size), BestX is enduring it does not stray into territory it expressly set out to avoid – providing rankings to LPs. “We have never wanted to get into the ranking business,” says Jerome. “This is our way of getting as close to providing that information without crossing the line – the anonymity is everything here.”
The new analysis can also be overlaid on other BestX services, for example the temporal analysis that effectively measures market impact. “This would help a client understand LP behaviour when, for example, they are trading full amount in clips or using an algo,” says Markwick. “This can be viewed across different time horizons and compared to the BestX risk transfer cost analysis, which indicates if the algo or ‘full amount’ strategy is beating the risk transfer price.”
Also, by comparing the PAWR versus the BestX market footprint measure clients can understand how the market is moving after each RFQ trade and whether that changes based on an LP’s PAWR. The perfect LP would be able to win trades and not move the market, for example being able to match the trade through their internalisation abilities. Likewise, counterparties that are winning trades but hitting the market should be reviewed. This type of analysis can be easily conducted using the new feature in BestX.
Looking ahead, Markwick says BestX is seeking to enhance the new service further, by building up a picture of which way counterparties are typically axed. “By splitting all our trades onto the left or right hand side of the price, we can start to see if any counterparties are picking up more of the left hand sided trades or the right,” he explains. “This means we can start understanding if there are their certain directions for certain currency pairs where a counterparty starts picking up more trades on one side of the price. Going forward, this could help clients pick up better matches across their counterparties or direct an order to an algo where the analysis indicates there will be a higher internalisation rate.”
Markwick stresses that, again, the data would have be statistically significant and the axes display a reasonable level of consistency, if that is the case then the analysis could be especially valuable at times like month-end when so many rebalancing hedges are executed.
“The intent of RFQ Par is to help LPs better understand where their strengths and weaknesses are and where, perhaps, they should be allocating resources,” says Jerome. “For the buy side, it helps them build smarter counterparty panels across their business. The result should be stronger relationships based upon significant analysis that highlights where two firms can best interact.”

