What Happened at the Month-End Fix?
Posted by Colin Lambert. Last updated: October 3, 2021
After a period of relatively quiet month-end London 4pm FX benchmark Fixes, August saw some significant moves ahead of, and during, the window, meaning the monthly analysis produced by Raidne and published by The Full FX, saw the second highest dollars per million saving recorded in what is the fifth of this series.
The data tables below offer a comparison with data delivered by Raidne, which owns the Siren Fix. The Full FX has independently verified that the WMR data, which is calculated from New Change FX data by Raidne, reasonably reflects the month-end rates delivered by WMR. This month, there was a just over one-pip difference (lower) in the NZD and around seven pips (higher) in NOK and SEK.
| August 31 |
| CCY Pair | WMR 4pm Fix* | Siren Fix | 100%** | 80% | 70% | 60% |
| EUR/USD | 1.18043 | 1.18127 | $711 | $386 | $257 | $129 |
| USD/JPY | 109.853 | 109.767 | $783 | $470 | $313 | $157 |
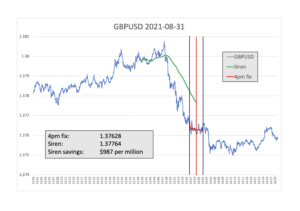
| GBP/USD | 1.37628 | 1.37764 | $987 | $592 | $395 | $197 |
| AUD/USD | 0.73086 | 0.73133 | $643 | $386 | $257 | $129 |
| USD/CAD | 1.26355 | 1.26274 | $641 | $385 | $257 | $128 |
| NZD/USD | 0.70396 | 0.70451 | $781 | $468 | $312 | $156 |
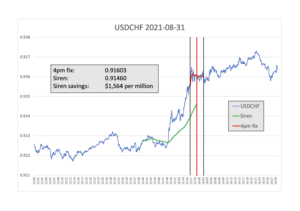
| USD/CHF | 0.91603 | 0.91460 | $1,564 | $938 | $625 | $313 |
| USD/NOK | 8.70465 | 8.69434 | $1,186 | $711 | $474 | $237 |
| USD/SEK | 8.63795 | 8.62587 | $1,400 | $840 | $560 | $280 |
| Average | $966 | $580 | $387 | $193 |
*According to Raidne calculation using NewChange FX data
** Savings are in dollars per million by percentage of correlation to the Fix flow. Blue cells signify a projected saving using Siren, Red cells a saving using WMR
To provide more context, the table also presents projected dollars per million savings across a portfolio of different pairs using a correlation with the Fix calculation, depending upon how much flow was in the direction of the market, or “with the wind”.
Probably the highlight of the analysis is the savings available in USD/CHF, which is the largest recorded thus far in one of the “four majors” at a massive $1,564 per million at 100% correlation. While the Scandi currencies regularly produce higher savings over a longer window, it is also noticeable that across the board the numbers are almost as high as April, which had an average saving of $1,054 per million at 100% correlation.
 Every month, perhaps pandering to the history of this writer, a chart for Cable is published, although the pair is often one with the largest impact in the pre-hedging window. At $987 per million, this is the second highest potential saving from the first five months’ of data in Cable, second only to May’s blow out $1,395. In what was previously referred to as the pre-hedging window (the FX Global Code now does not include the prefix when referring to fixing orders), Cable dropped almost 50 pips, leading to the high monthly saving.
Every month, The Full FX selects an emerging market currency pair at random, and those who like big numbers will be disappointed this month that we didn’t pick ZAR or MXN, which both had over $1,000 savings versus GBP, instead we plumped for CNH.
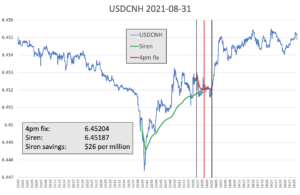
As the chart indicates, there was pre-hedging activity in CNH early, however this was reversed, perhaps suggesting that liquidity was deeper than expected by the firm pre-hedging. Either way, there was still a saving using a longer window, of $26 per million, based upon the NCFX calculation.